
Predicting hypotension after surgery
In collaboration with University of Washington
TL;DR: Postoperative hypotension is associated with adverse outcomes, but intraoperative prediction of post-anaesthesia care unit (PACU) hypotension is not routine in anaesthesiology workflow. Although machine learning models may support clinician prediction of PACU hypotension, clinician acceptance of prediction models is poorly understood. 😭 As a response to this, we conducted a thorough user research at two major hospitals and subsequently developed a clinically informed machine learning model using preoperative and intraoperative data.
For evaluation, we recruited 9 anaesthesiologists, who made 192 predictions of PACU hypotension each using a web-based visualisation tool with and without input from the machine learning model. We found that the ability of anaesthesiologists to predict PACU hypotension was improved by exposure to machine learning model predictions! 🥳 Clinicians acknowledged value and trust in machine learning technology. 🤖 👩🏽💼🙎🏻♂️
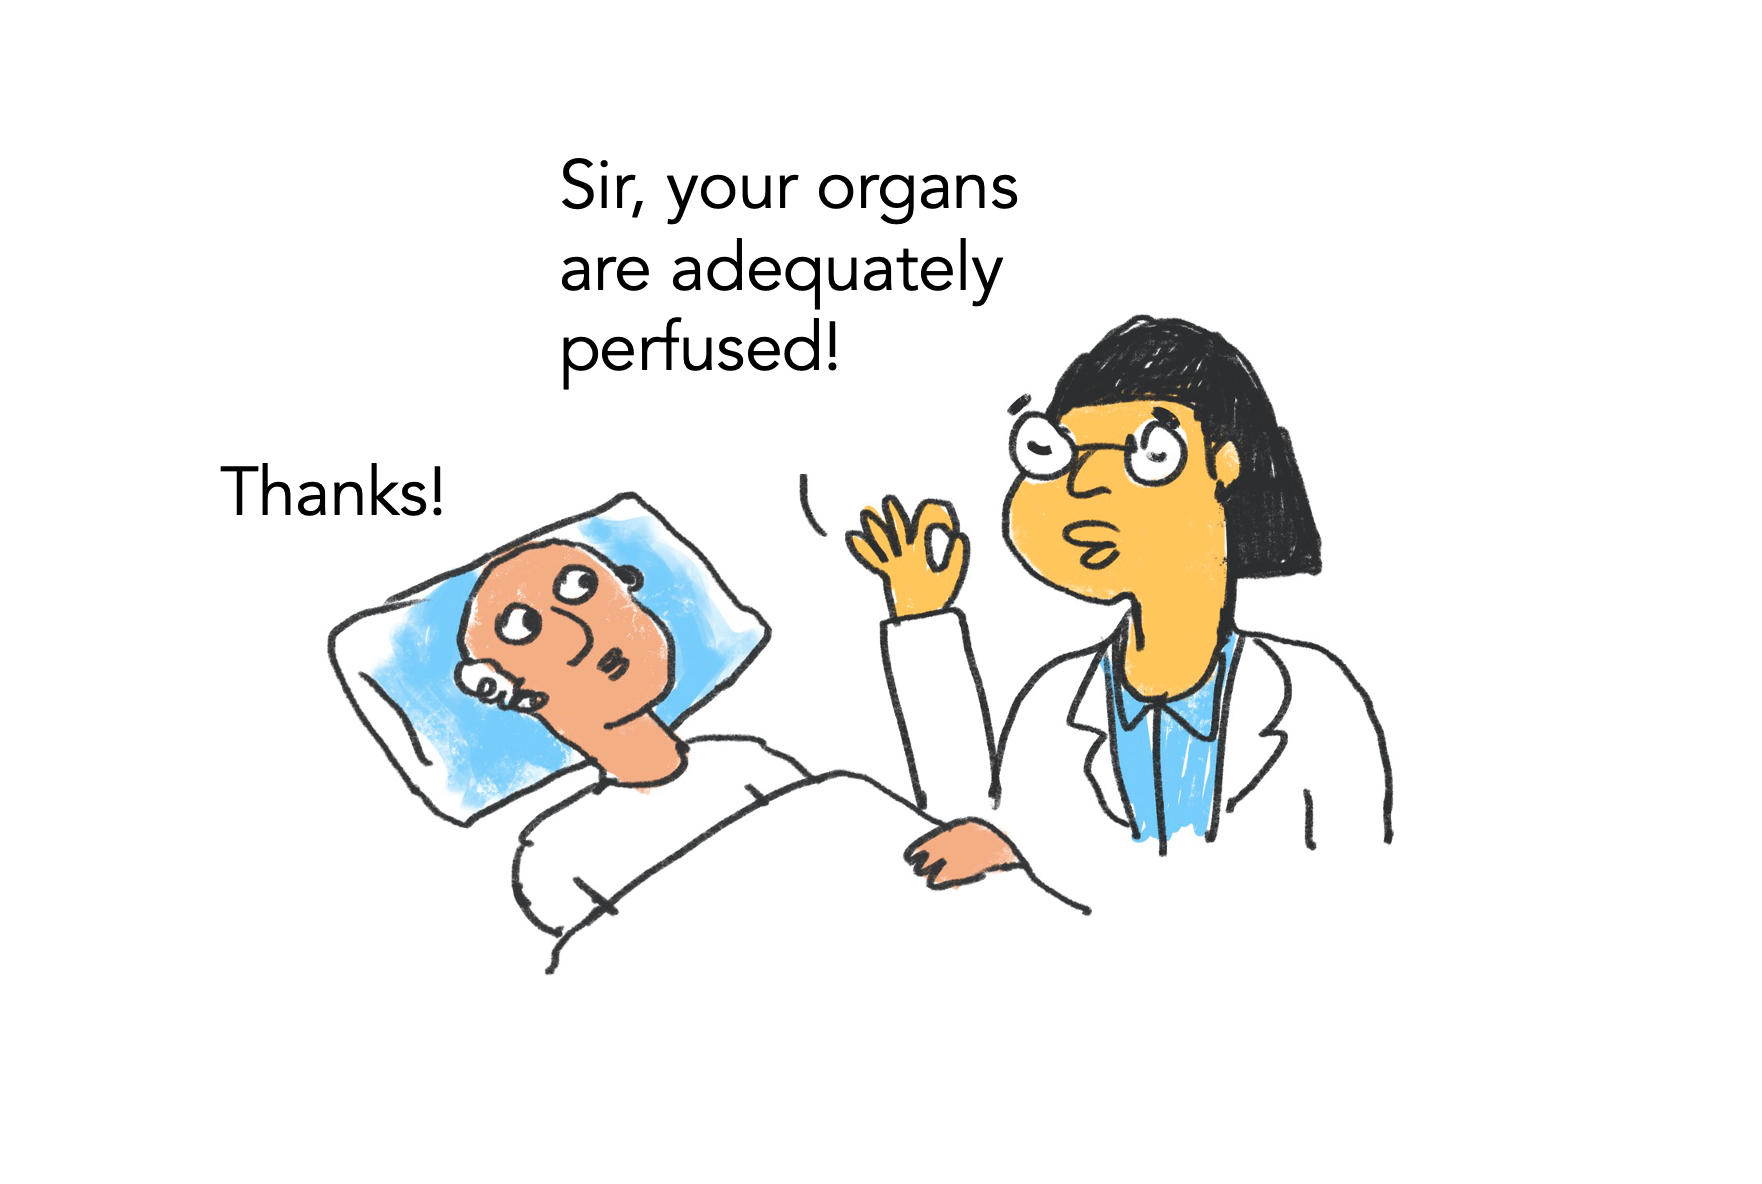
What is hypotension?
Hypotension is low blood pressure, often defined as a mean arterial blood pressure below 65 mmHg. It is vital to maintain blood pressure above this threshold for organs to be adequately perfused and their proper functioning.
The big WHY
We knew our collaborators and had some idea of the challenges which predictive analytics could solve. By way of workshops, we realised the importance of solving these problems in relation to each other. And hypotension was the winner! Through these sessions, we identified various challenges on the patient journey map and got the participants to vote on them based on key attributes such as impact, actionability, data availability and patient burden.
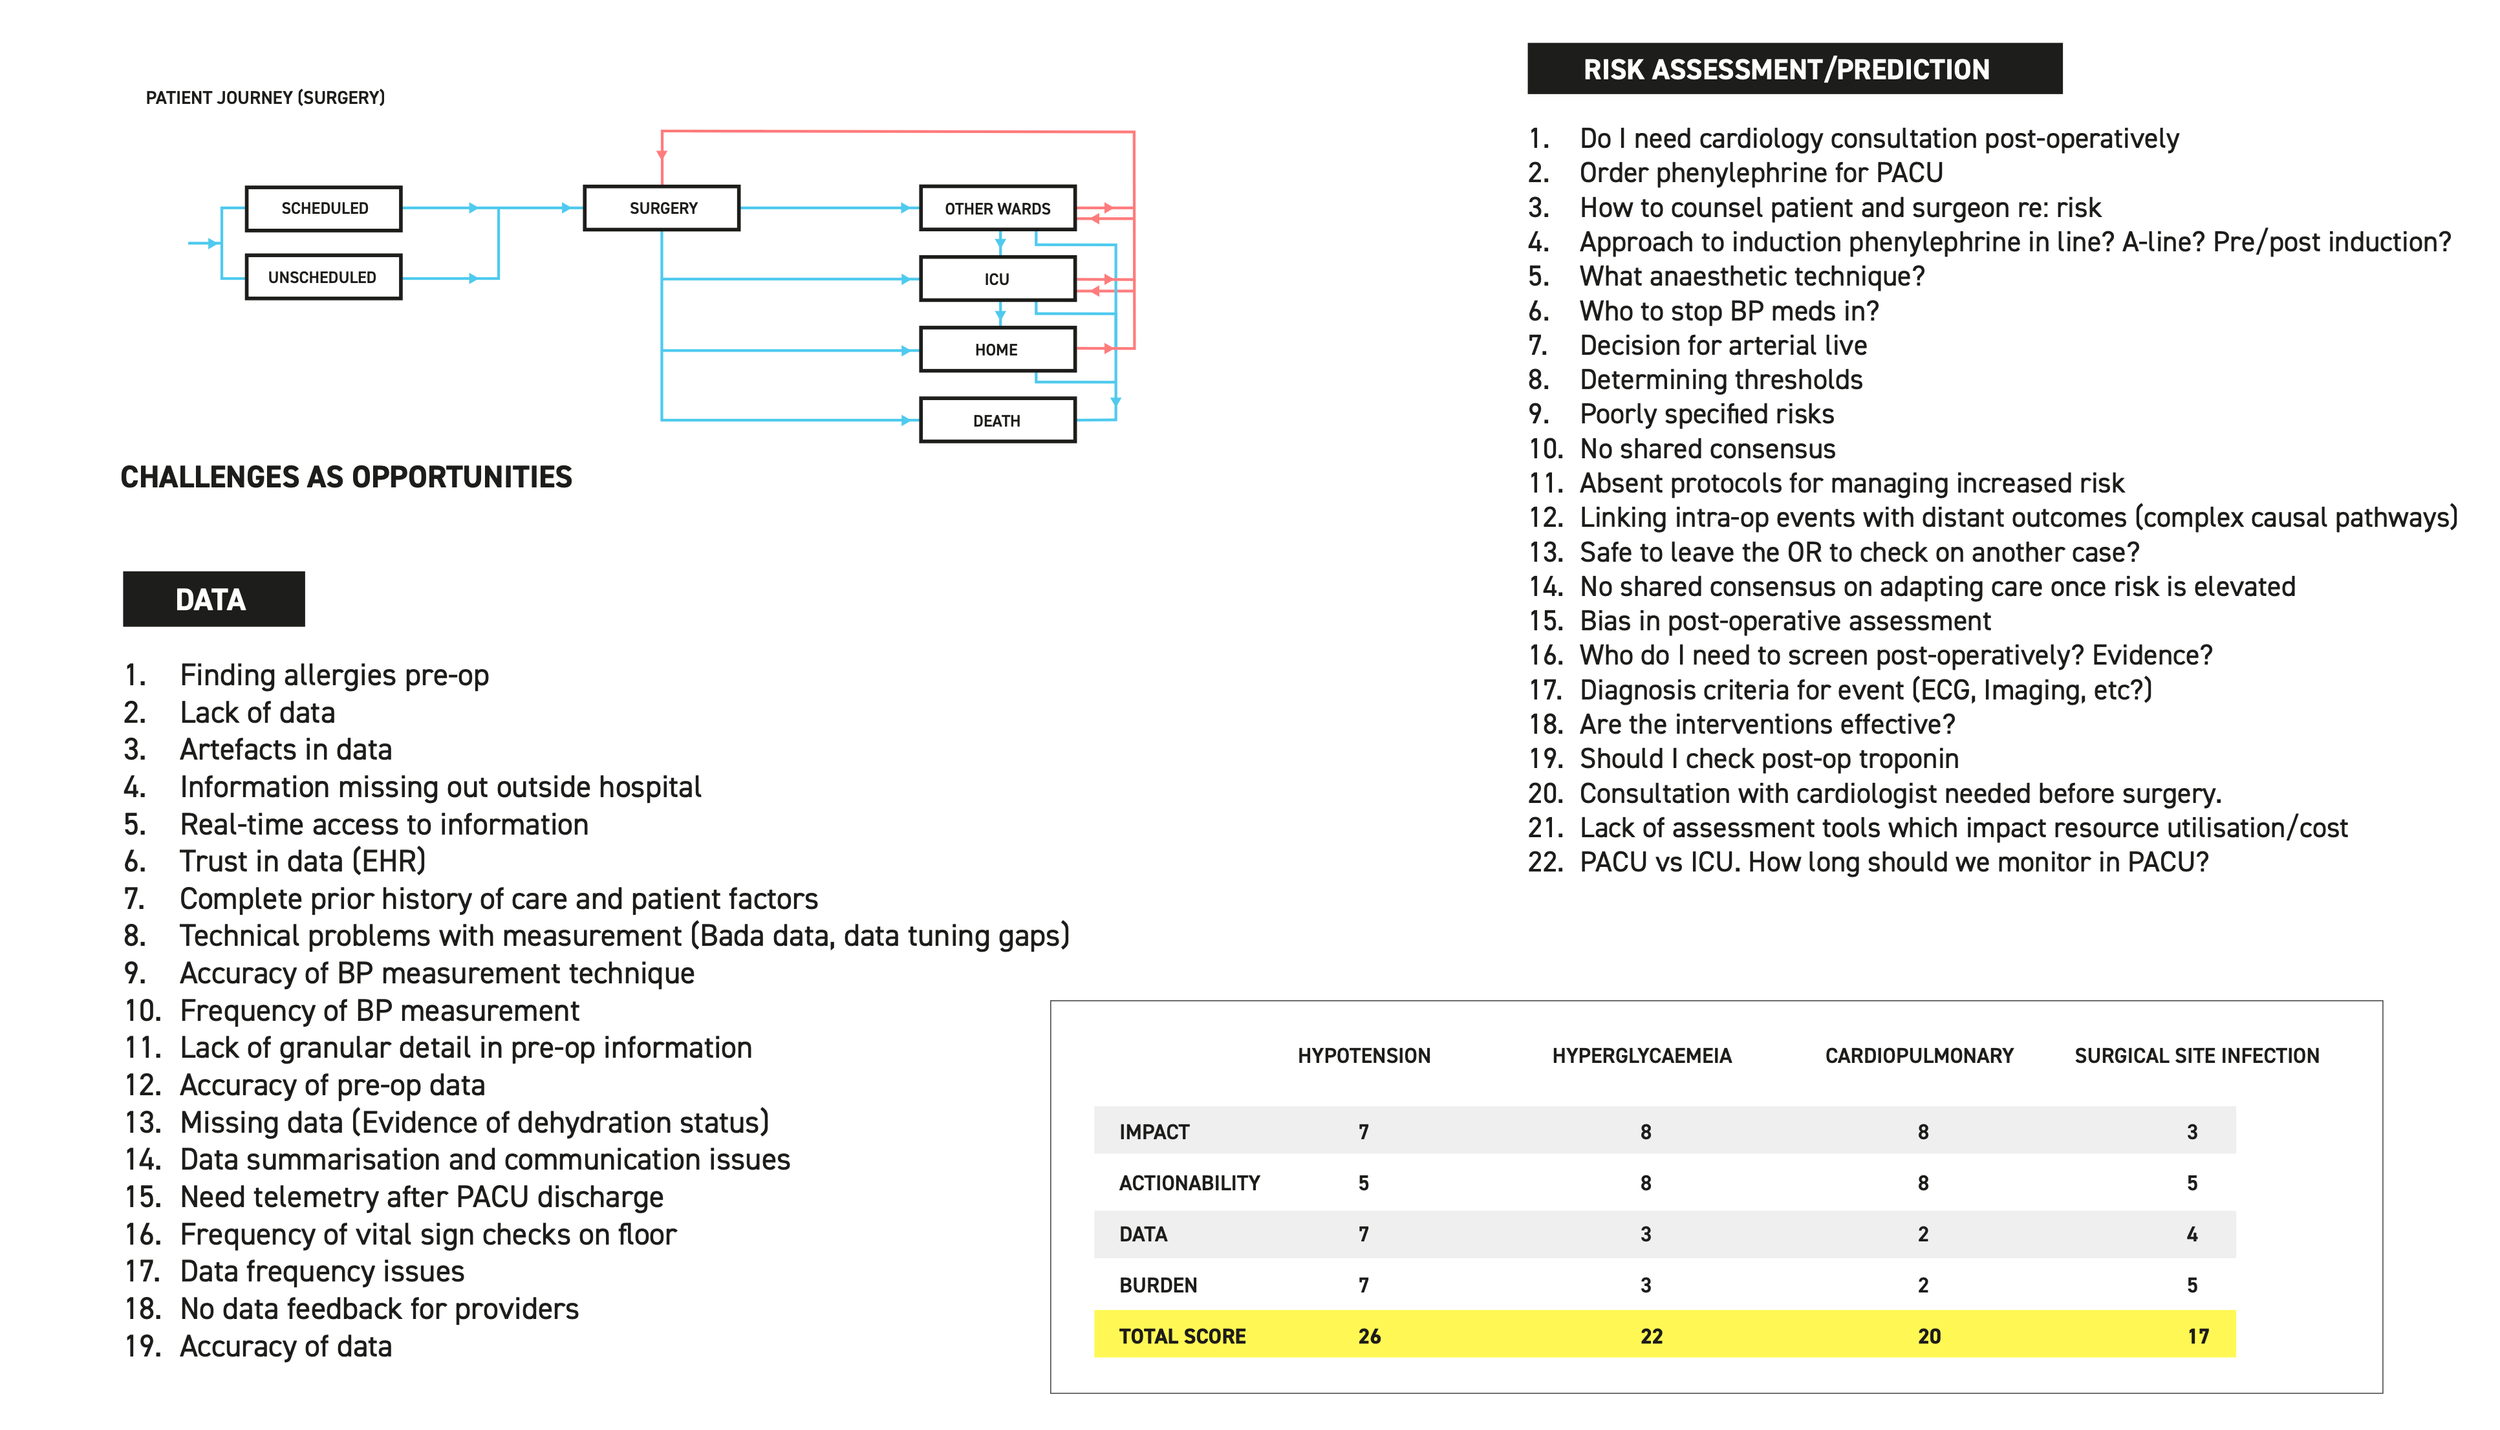
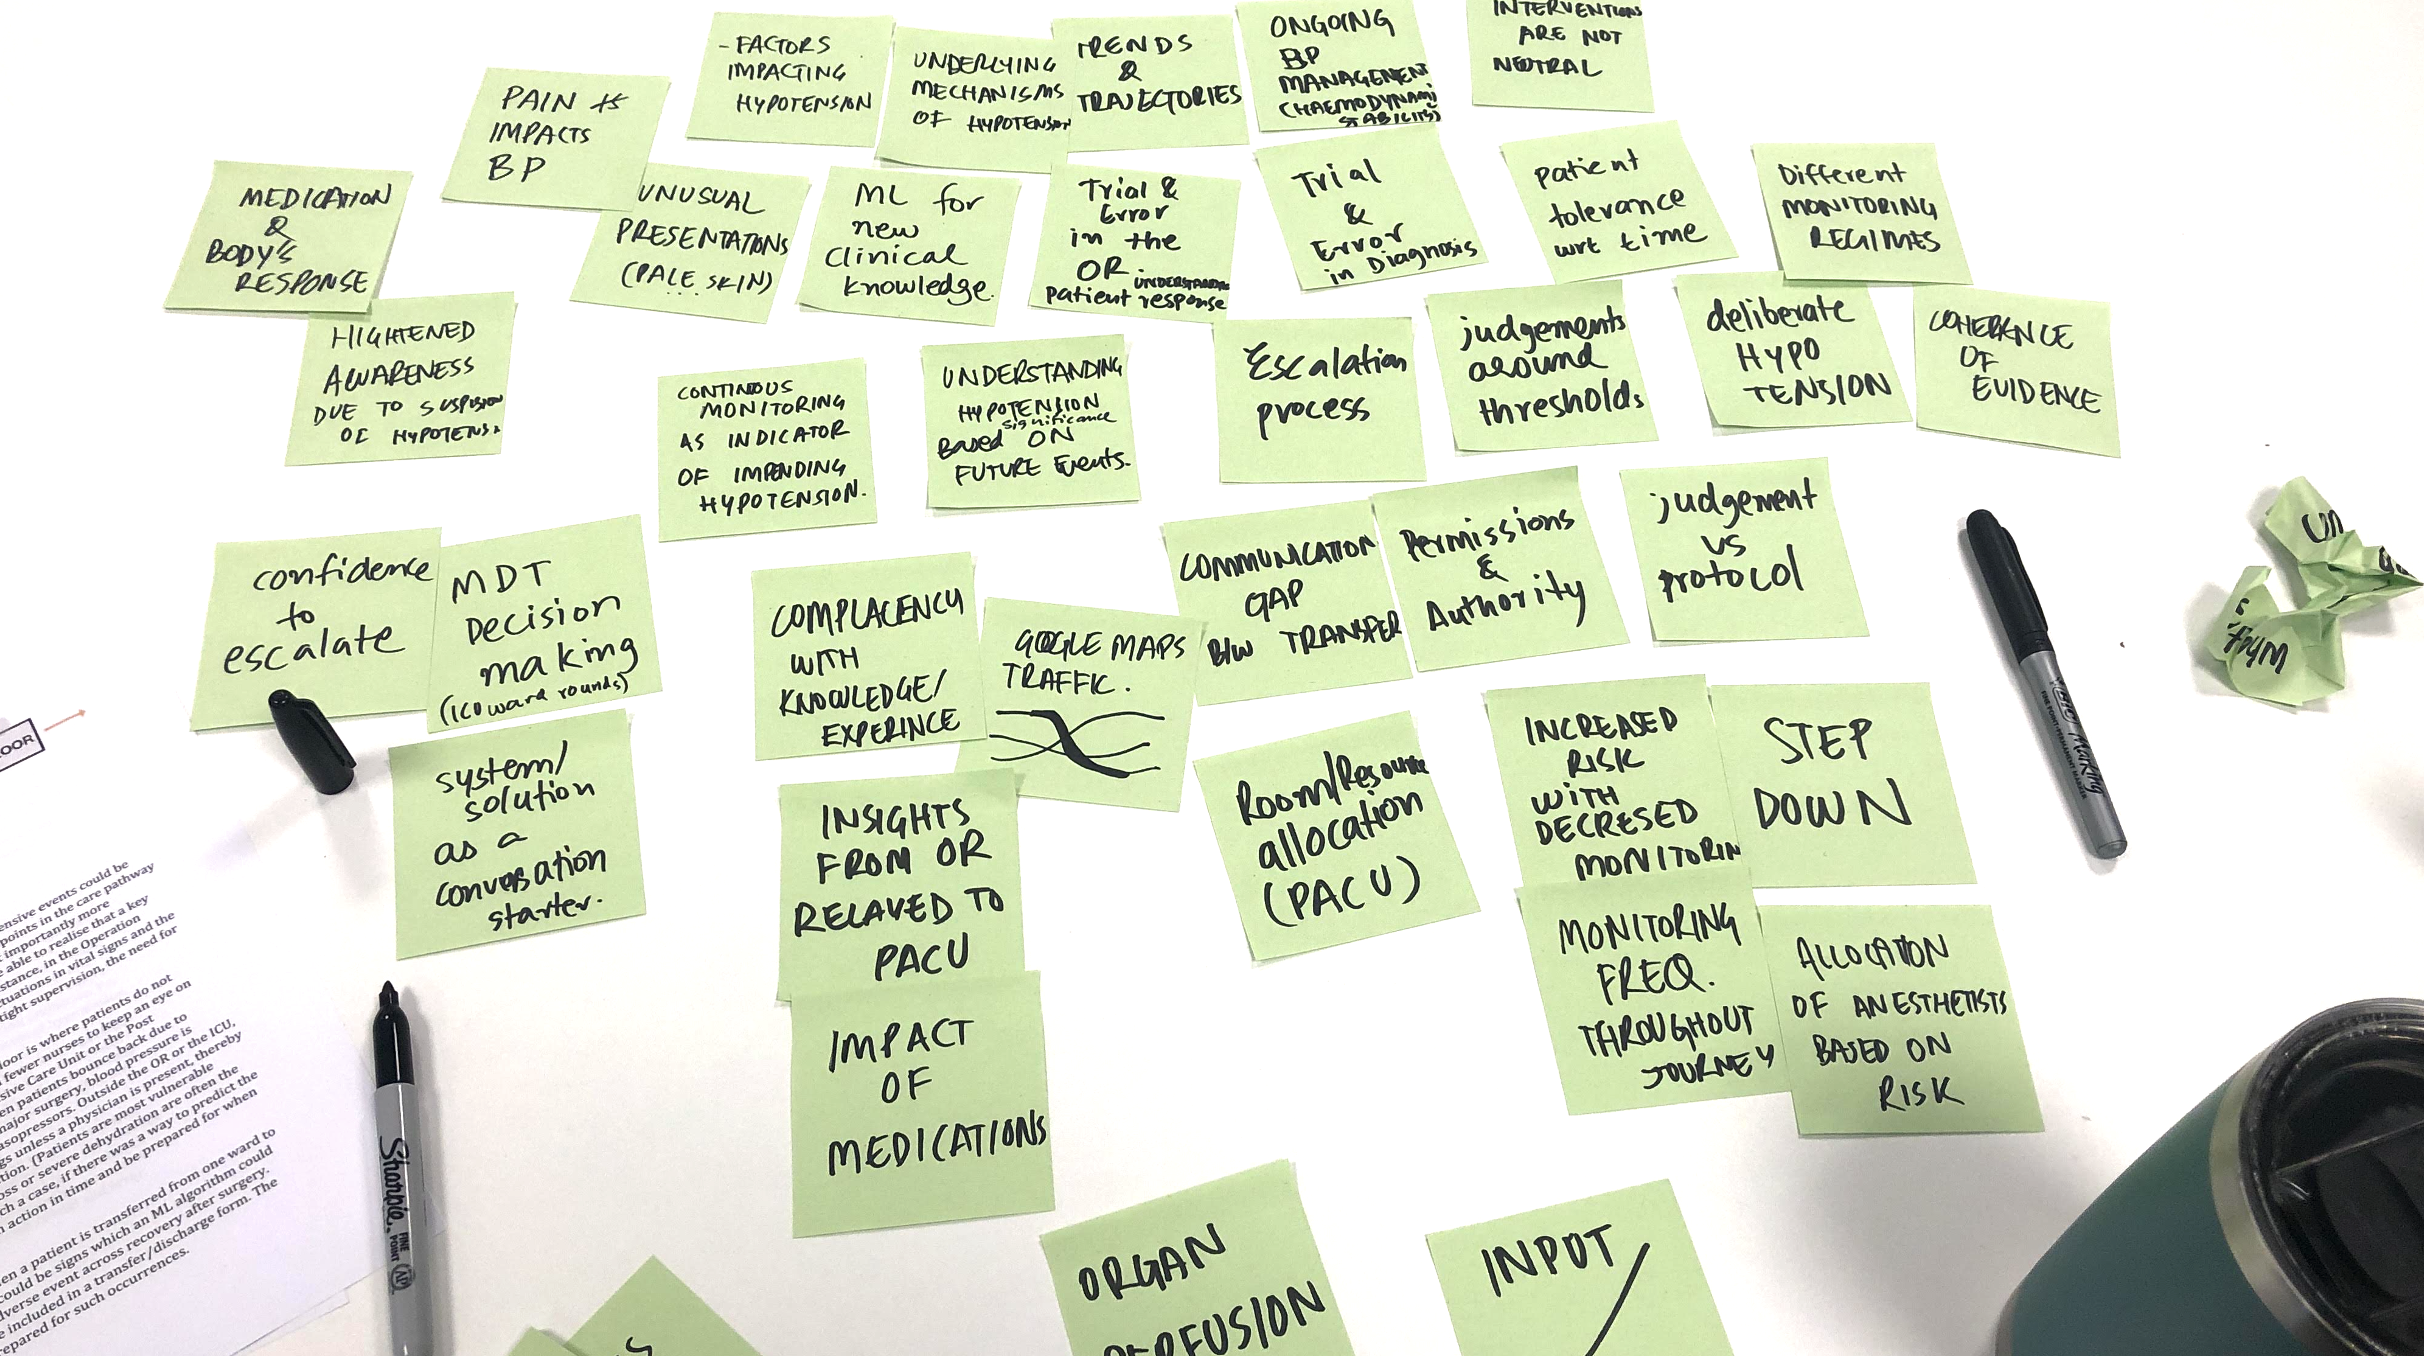
Various user challenges identified during the first workshop.
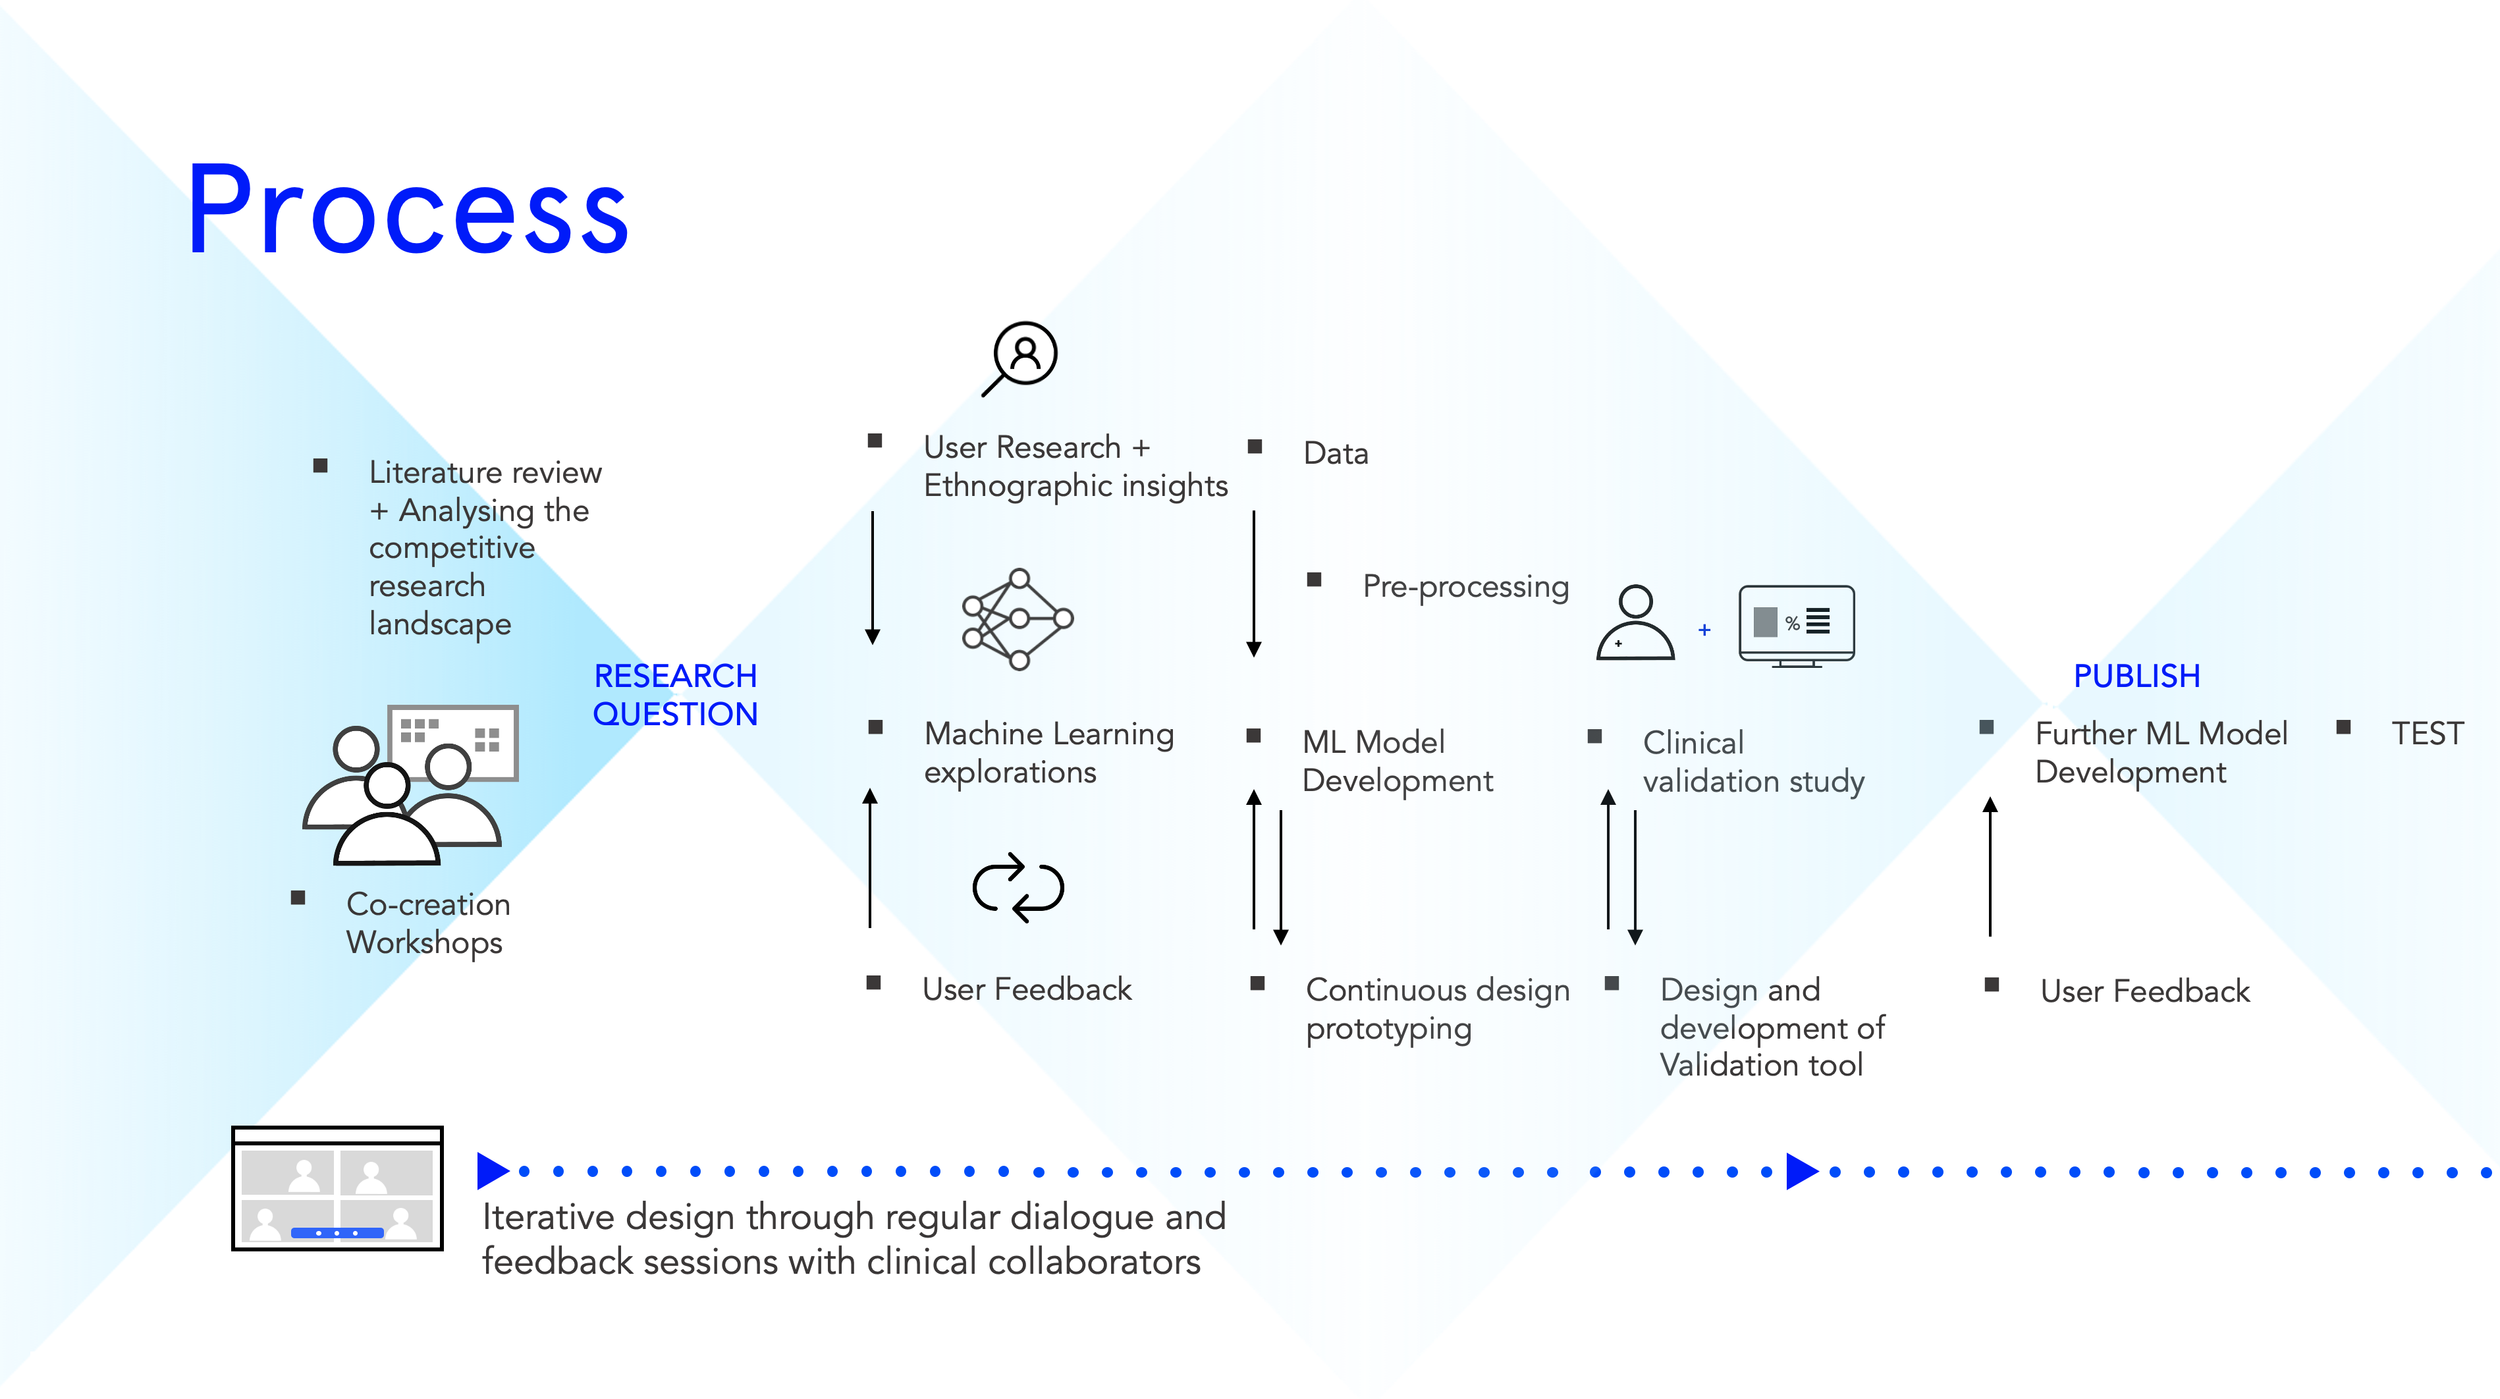
Design thinking all the way
Below is a map of what the overall process looked like. We started with literature reviews and put together a competitive landscape of ML for adverse event prediction. Through co-creation workshops, we narrowed down on the research question before embarking on user research and ethnography.
We visited two hospitals: Harbor View Medical Center and UW Medical Center in Seattle. We interviewed 15 participants including anaesthesiologists, fellows, residents, ICU nurses, Floor nurses, PACU nurses and CRNAs (certified registered nurse anesthetists).
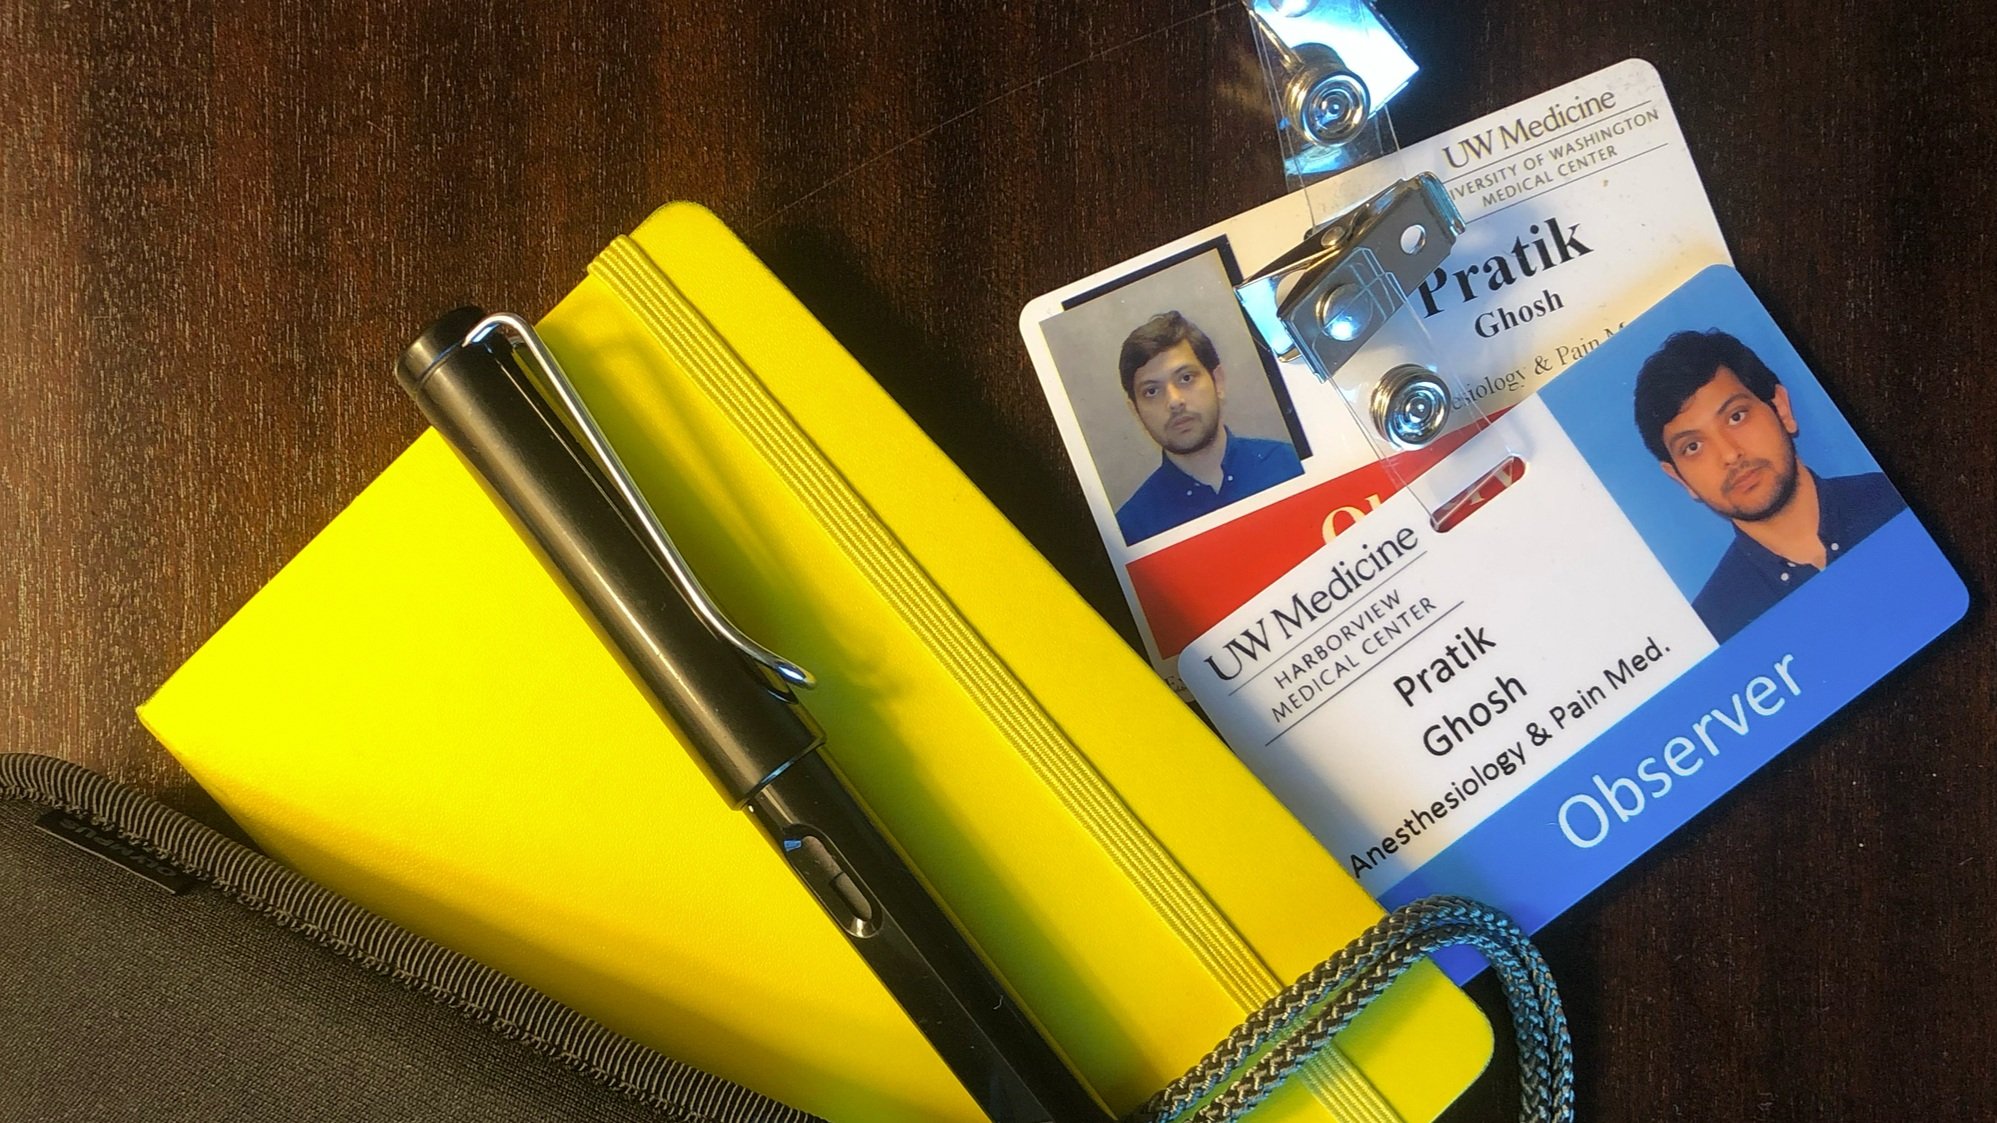
Getting to be an observer in a hospital is the best thing ever for a researcher interested uncovering user challenges.
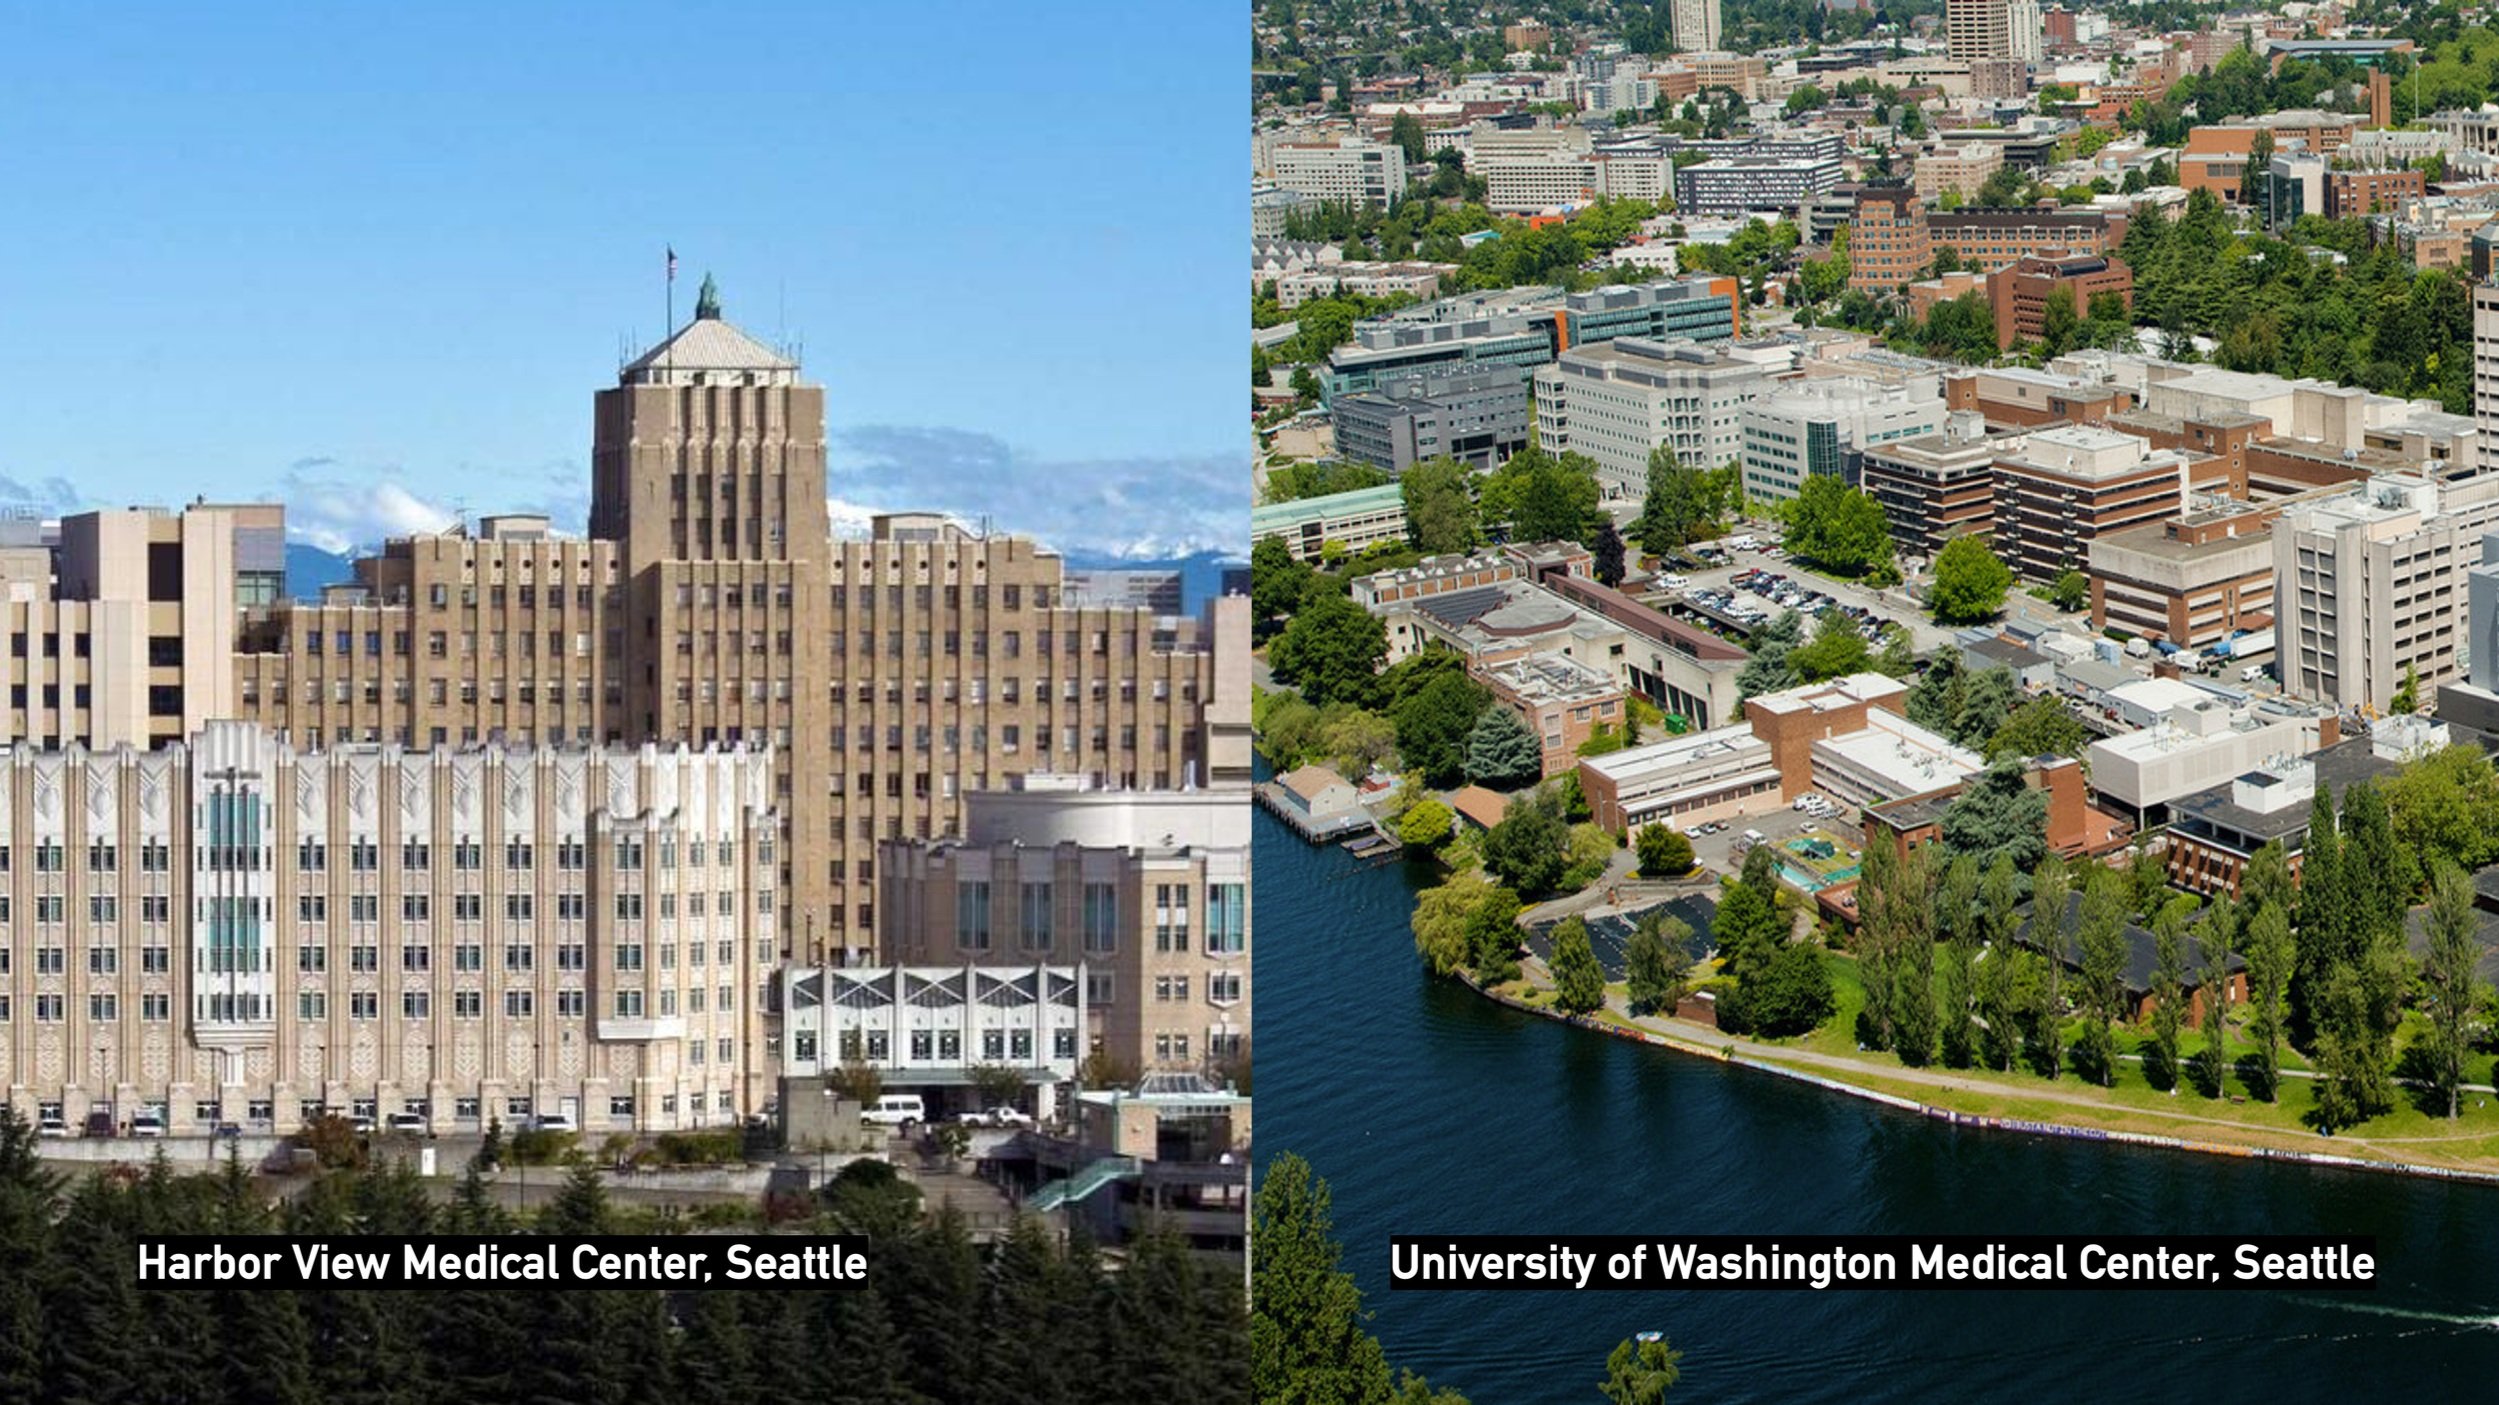
Harbor view on the left and UW medical center on the right, both hospitals have distinct flavours in terms of the patients they get and the specialities they have.
User research
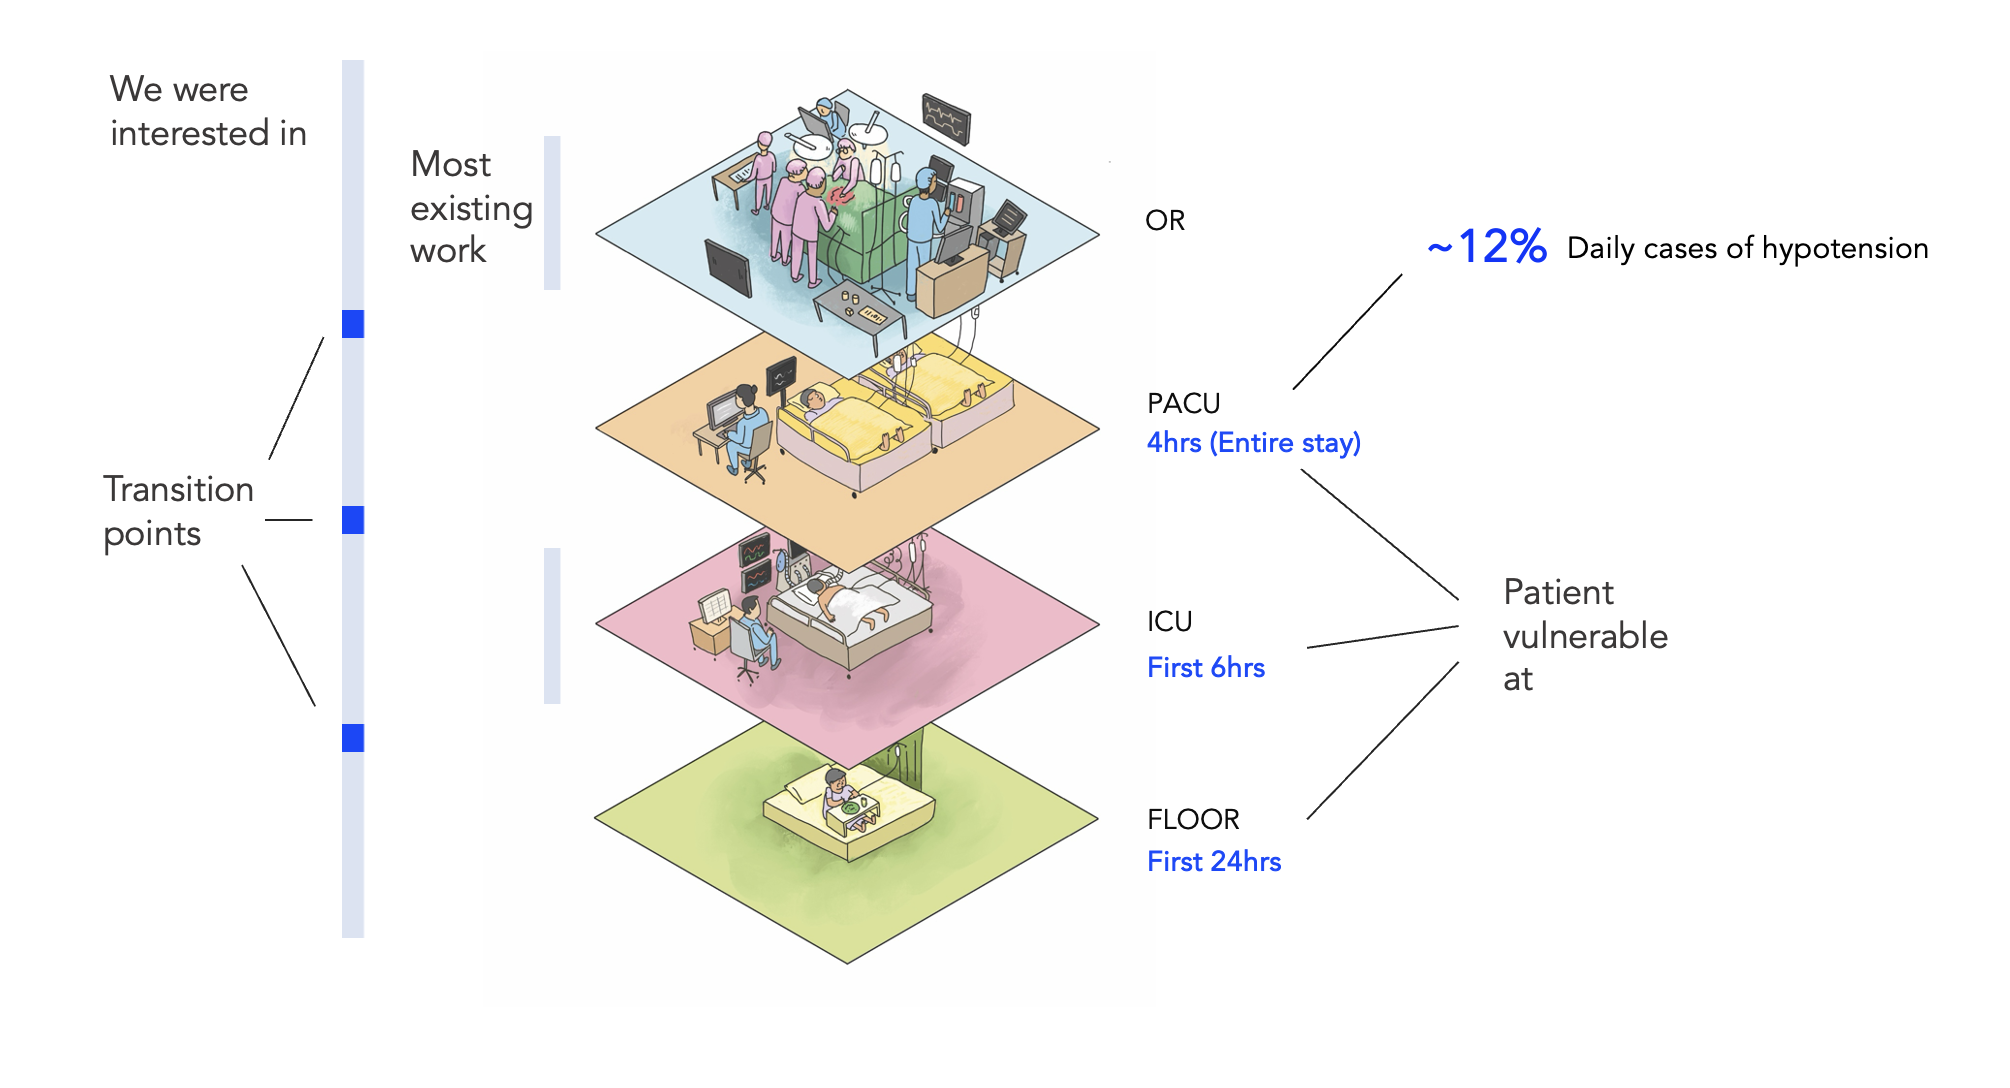
A patient goes through multiple wards during their stay at the hospital. While existing literature on ML based prediction was mostly situated in the ICU (likely due to easily available high-fidelity data), user research revealed that points at which a patient is most vulnerable are: First 4 hrs in the PACU, first 6 hrs in the ICU and first 24 hrs on the general ward. This was finding was further backed up by looking at the anonymised patient flow data which was made available to us for analysis. More than 12% of patients who go through PACU, become hypotensive and need escalation. 🤯
Thematic analysis
Thematic analysis of the user study data revealed further several insights into user challenges, needs and aspirations. It is a messy process but extremely visual and I love it!. Themes emerged from this exercise but not all themes are equally impactful or feasible.
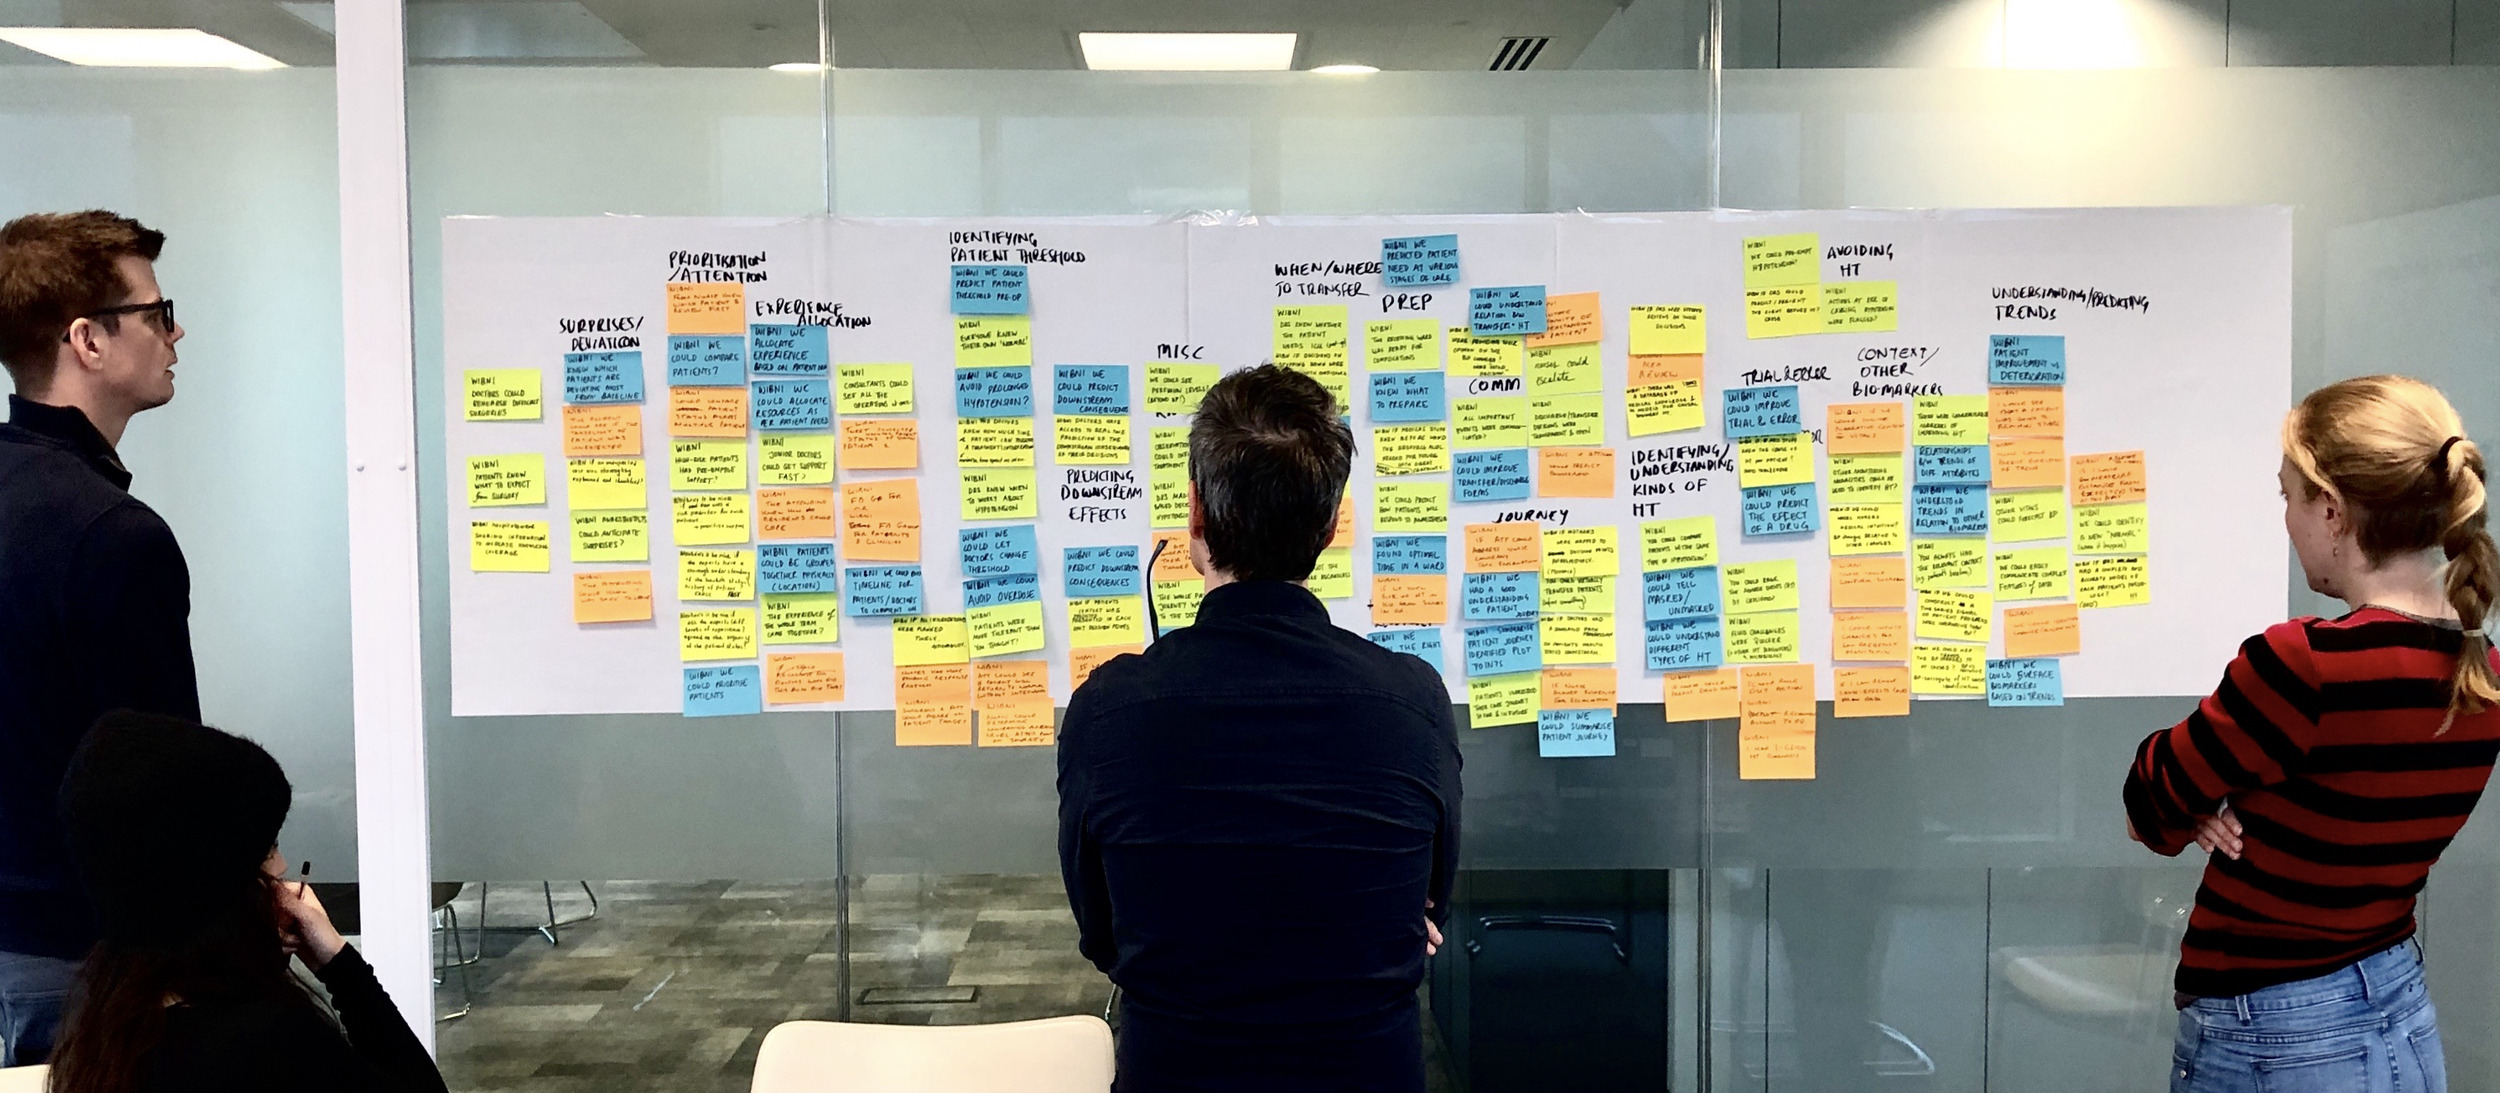
Internal workshop post thematic analysis was done through collective convergence. The team came together, brainstormed and aligned on what was realistic with resource constraints and yet impactful.
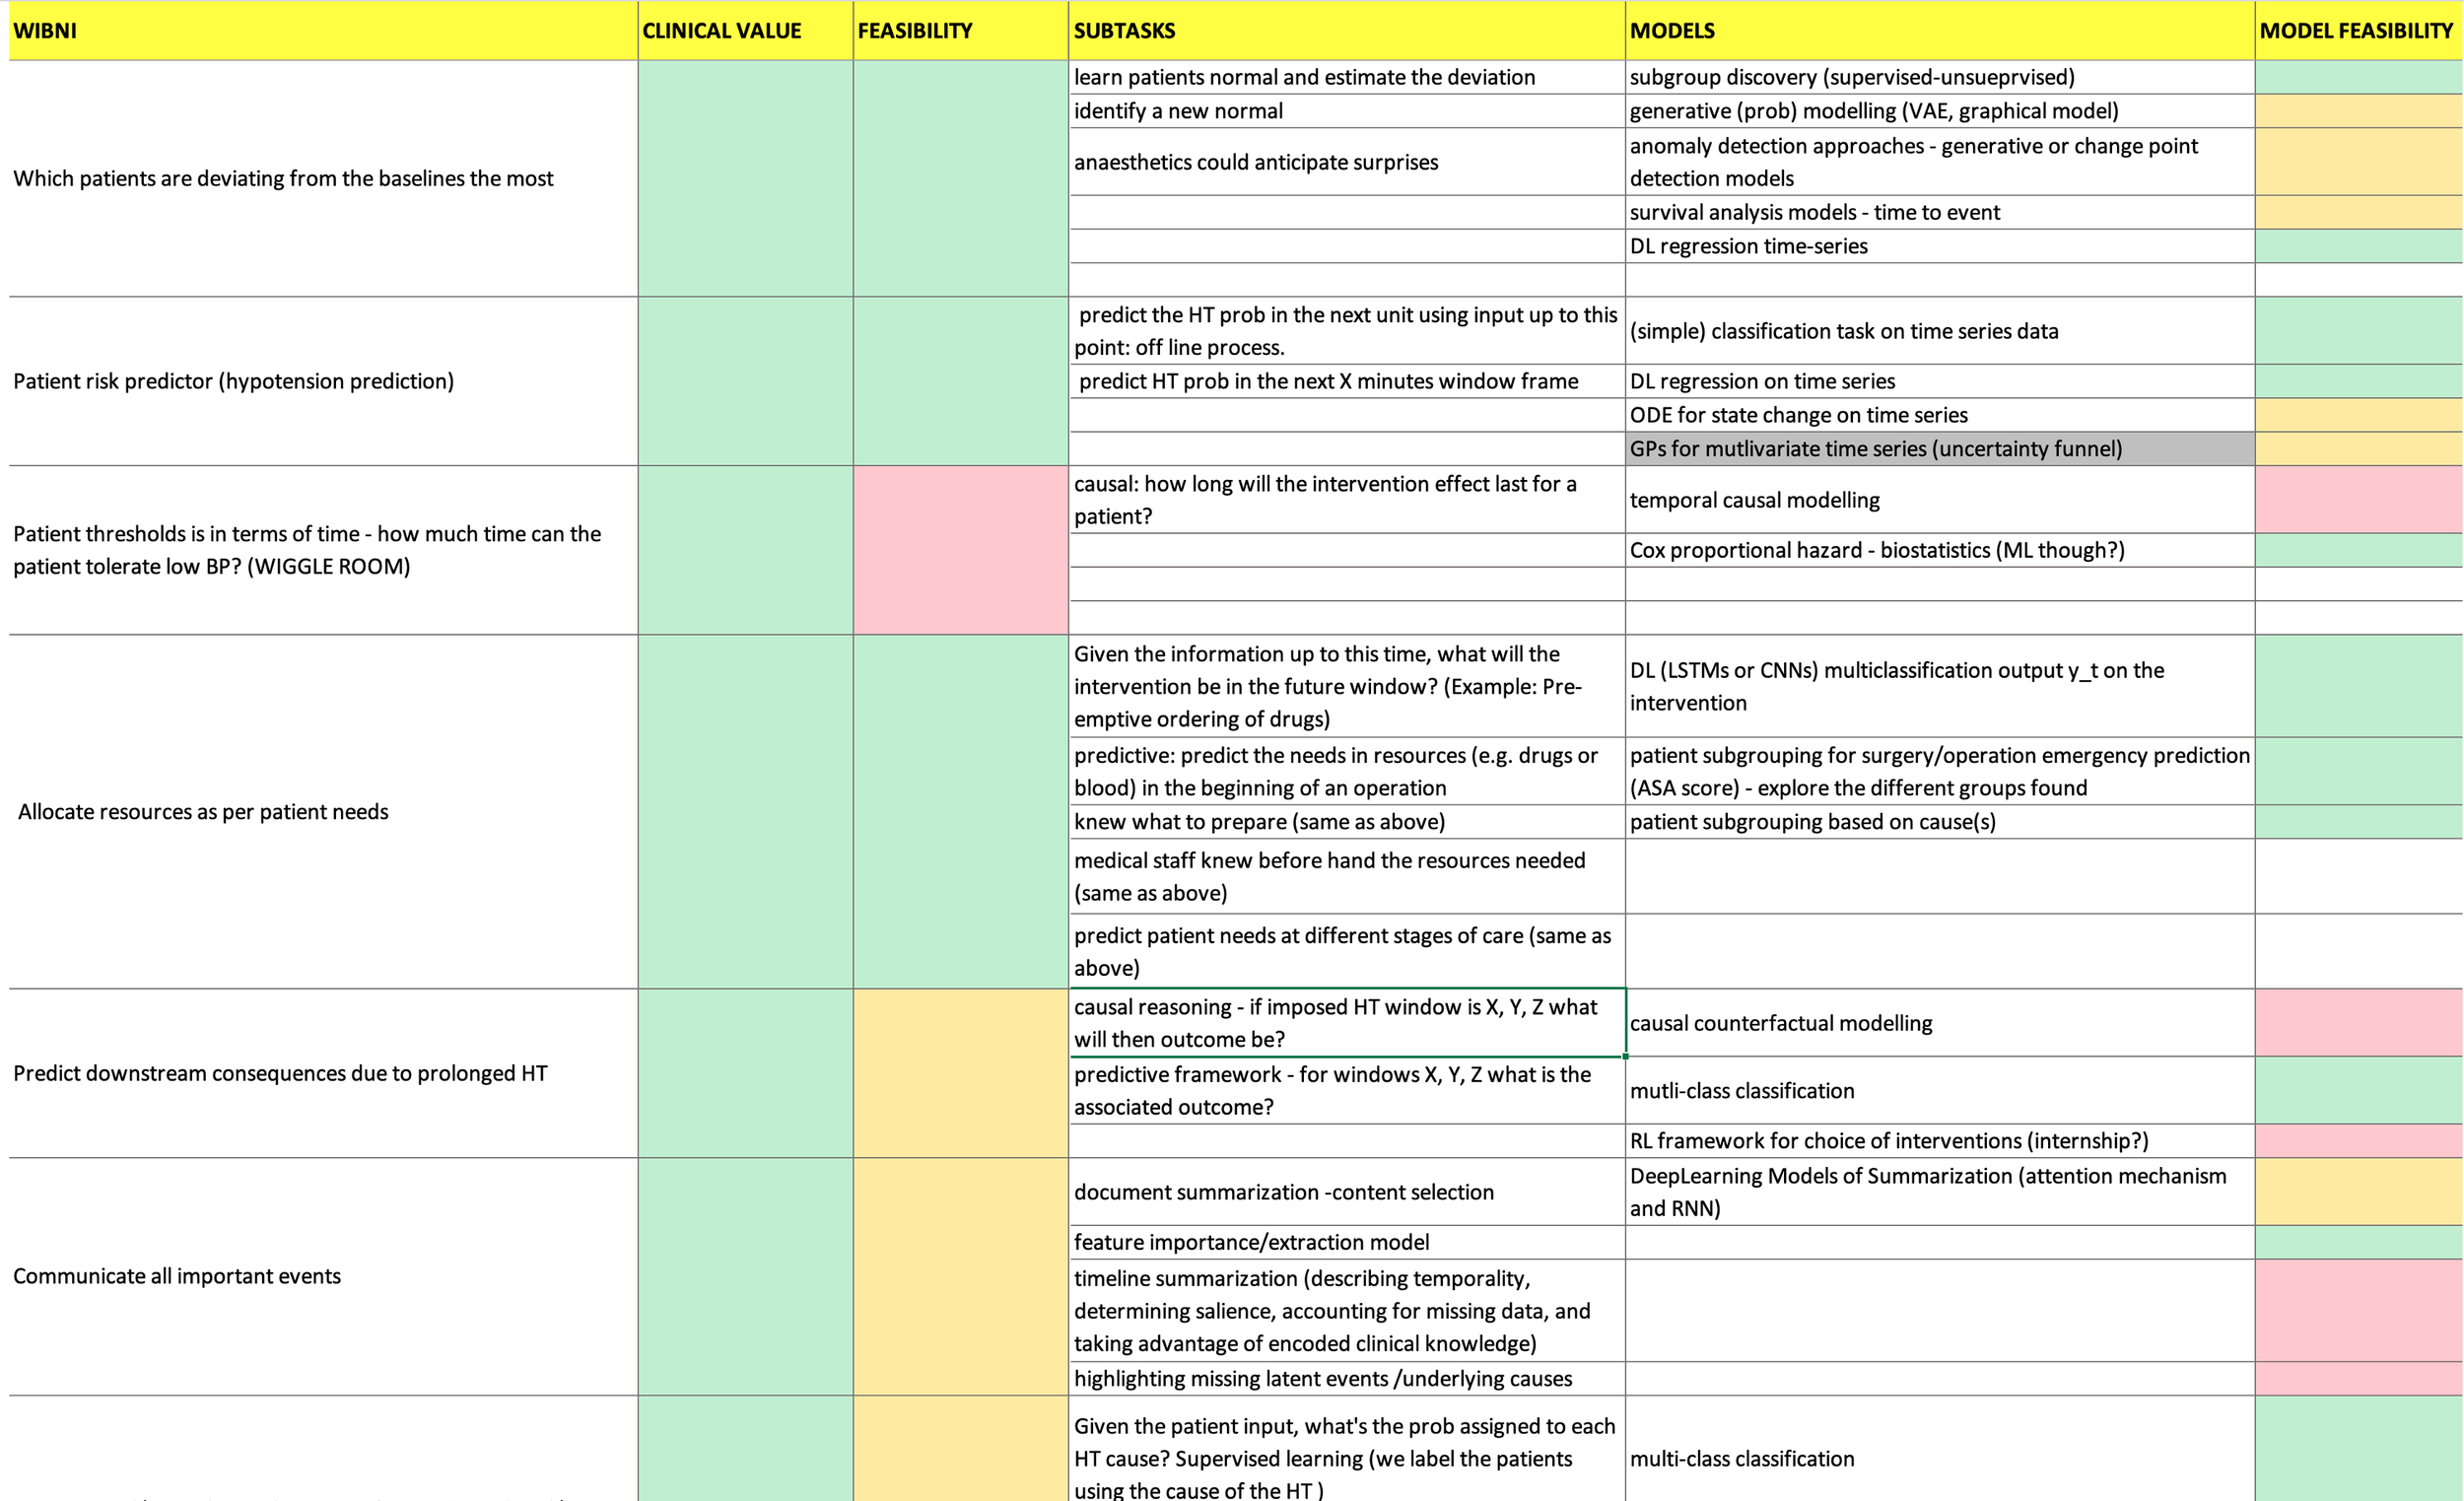
Impact and Feasibility analysis of themes.
End user experience
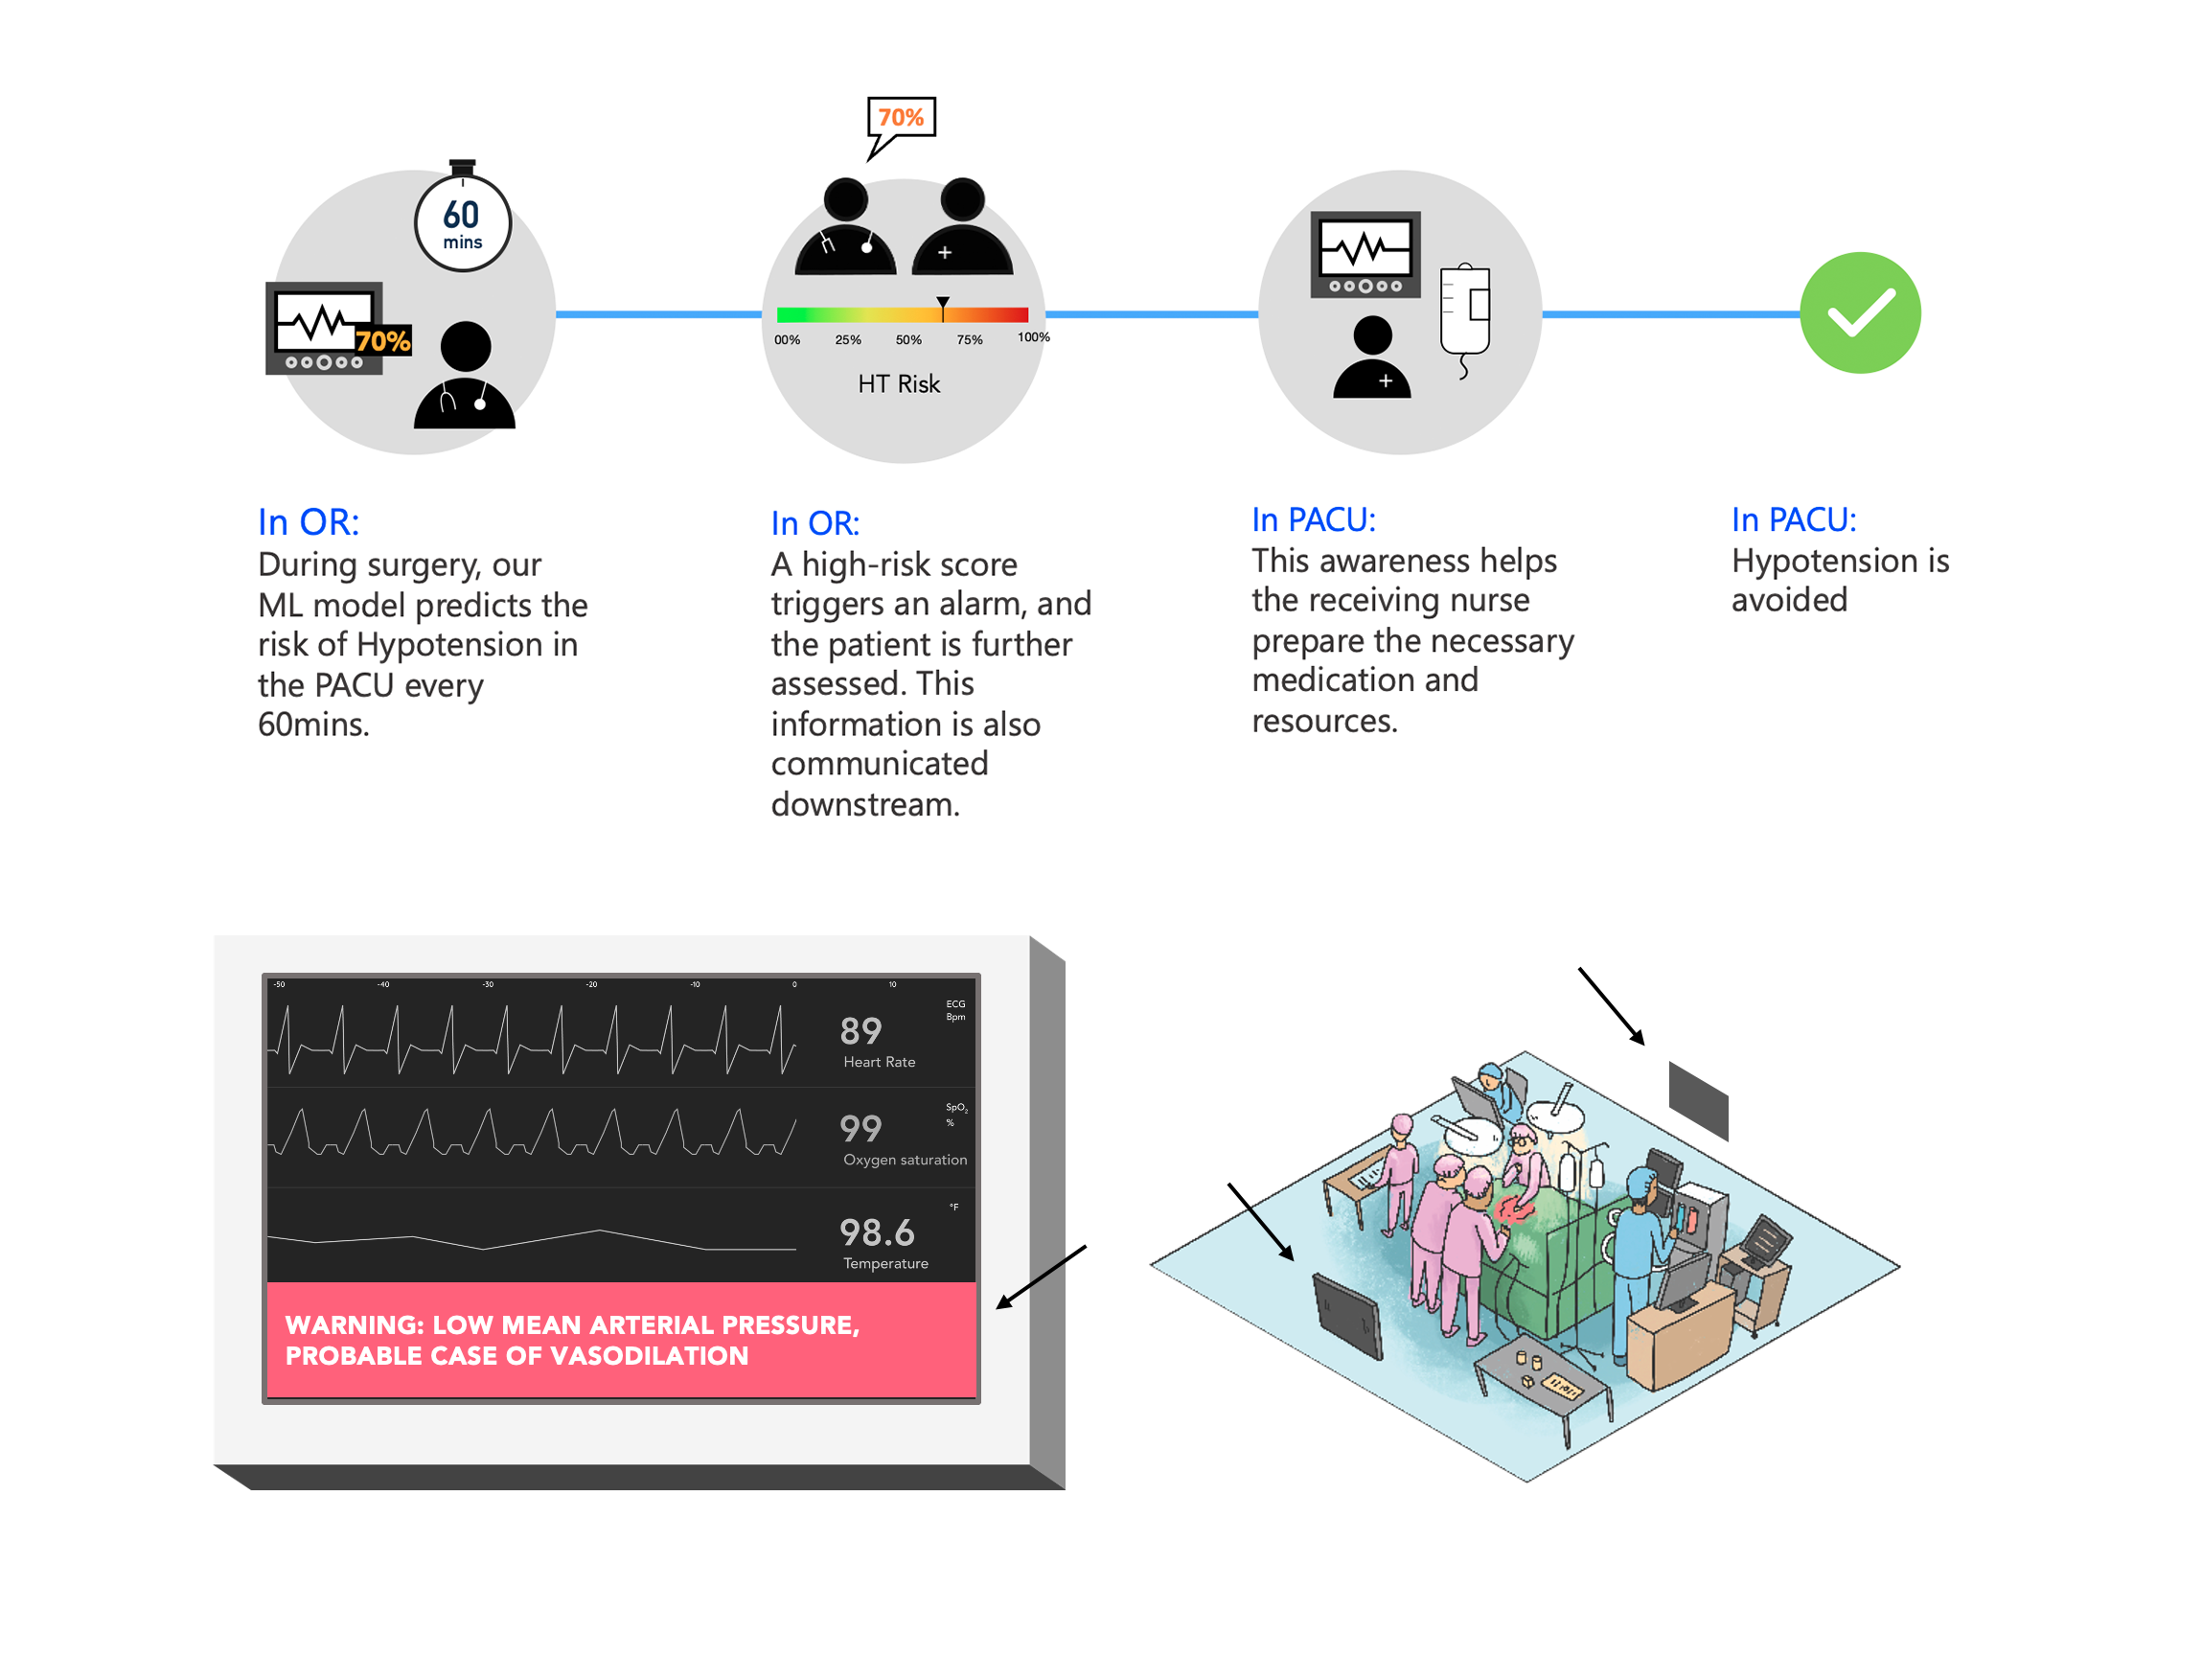
One of the experiences we decided to realise was around the transition of a patient moving from the OR to the PACU. At the end of the surgery in the OR, our model would predict the risk of hypotension in the next phase- the PACU. This risk would be shown to the Anaesthesiologist on an accessible computer who then would call up the PACU nurse and inform them of any special requirements. This could be keeping certain medications at hand or monitoring the patient more frequently. or assigning an extra nurse. So, by providing predictive insights at the right time at the right place, we would have a way better chance of avoiding hypotension.
Translation to ML task
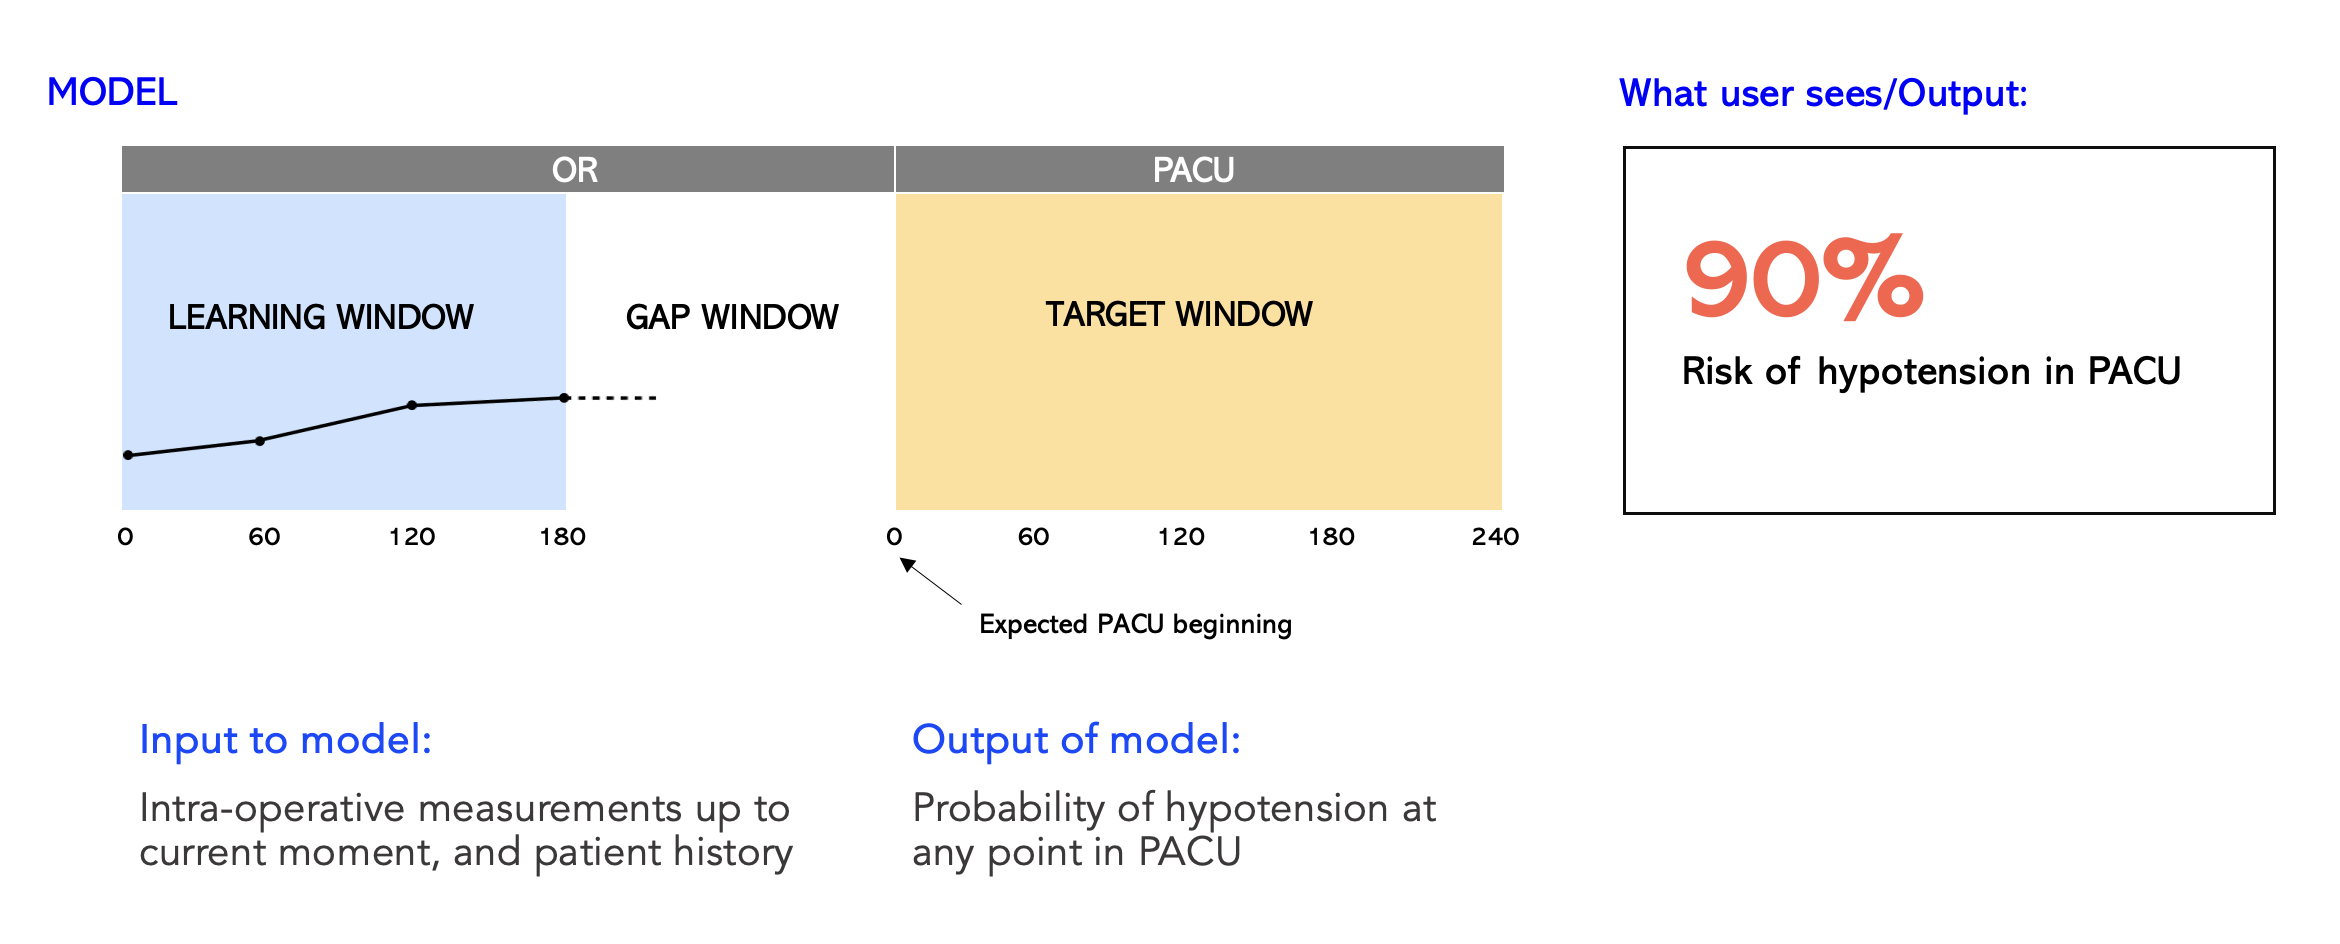
What we wanted to do is produce a risk estimate for hypotension in the PACU using the information from the OR. This becomes the learning window and the input to the model. Then there is a gap and the entire duration of PACU stay becomes the target window. The overall ML challenge is then a classification task. Given what the model has seen so far, will this patient become hypotensive or not? 🤔
Communicating actionable insights
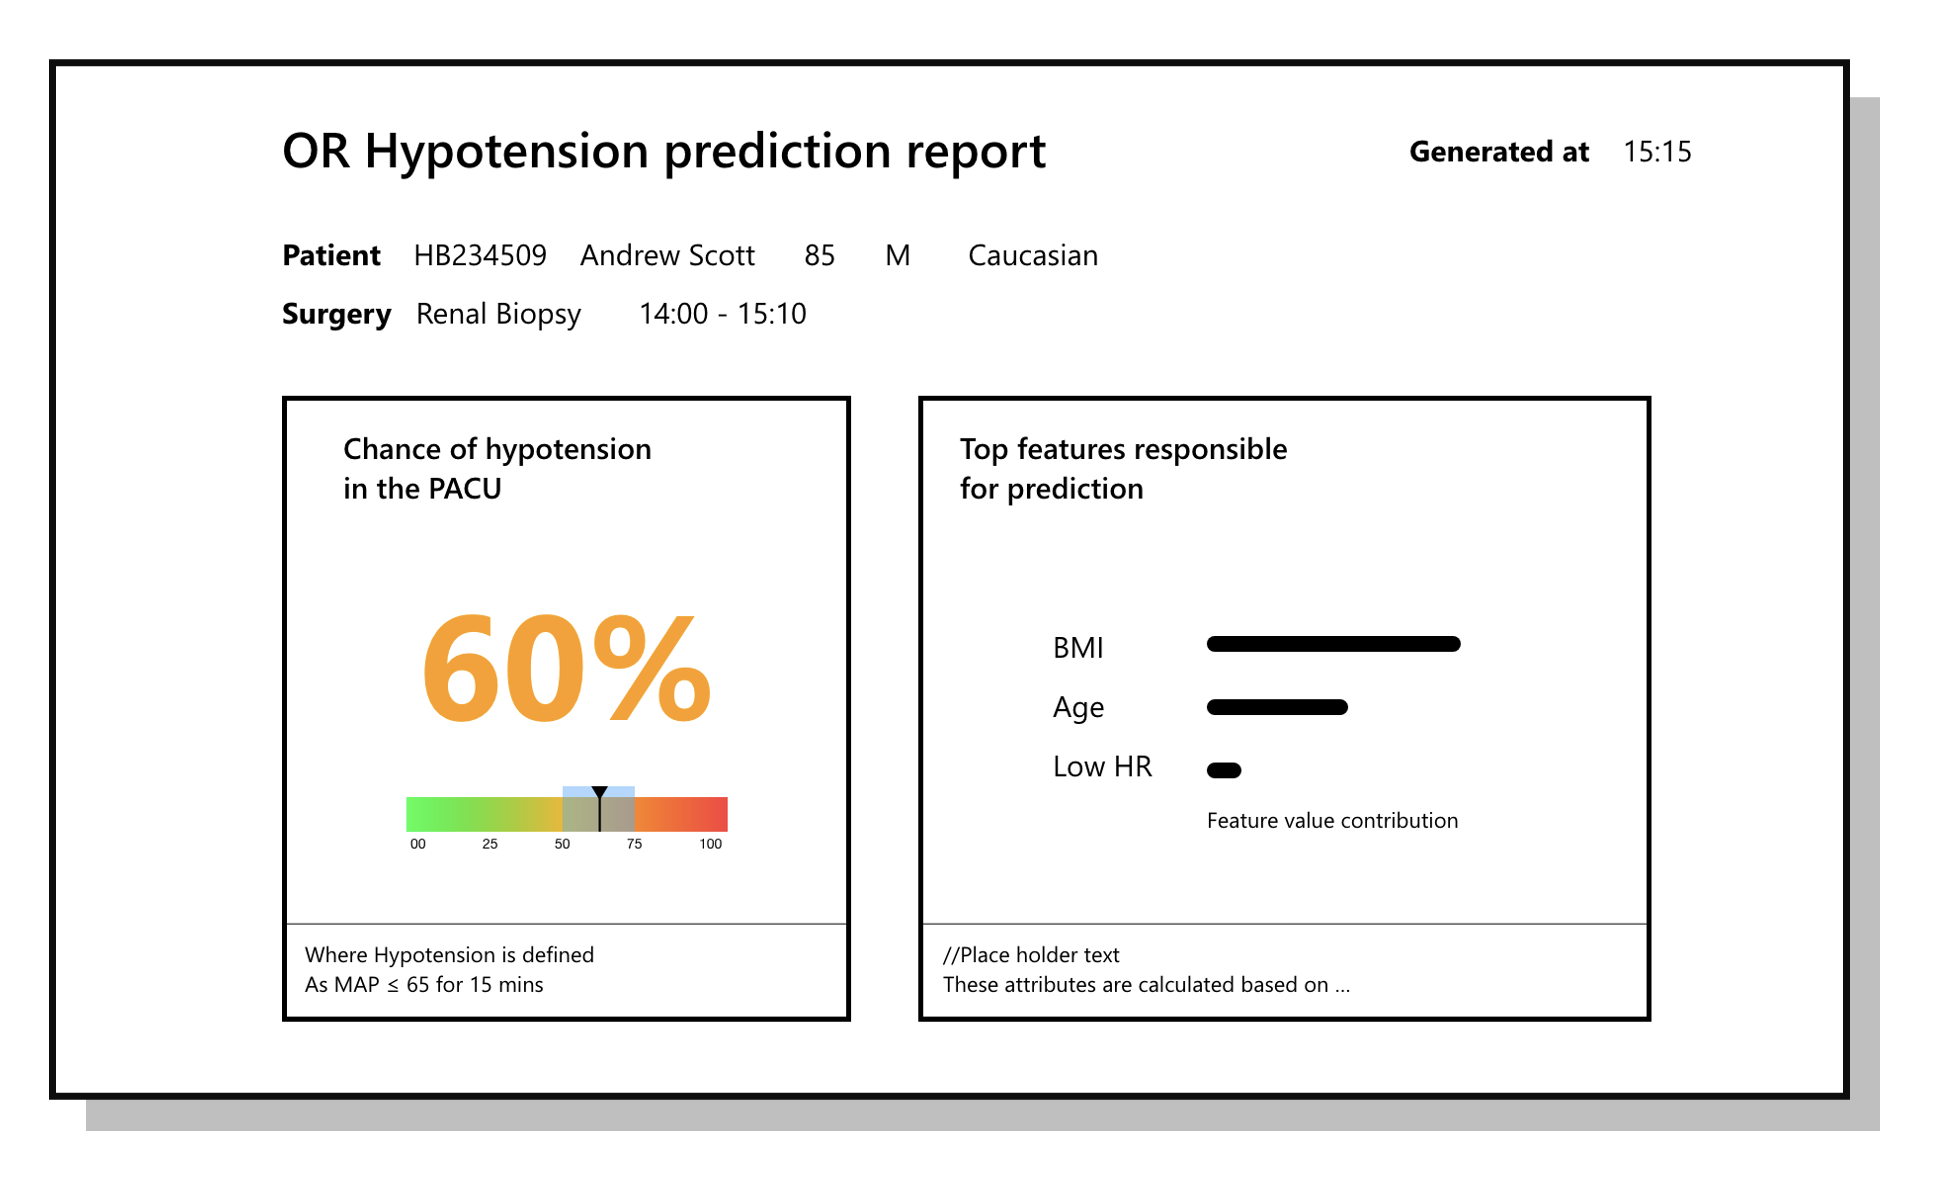
While the infographics below might not look like much, in a hospital setting, you want to strip away as much embellishment as possible from the design for quick readability leading to efficient action. By way of several iterations and user feedback, we decided to go with a minimal design that highlights the chance of hypotension. Underneath, we show the margin of confidence.
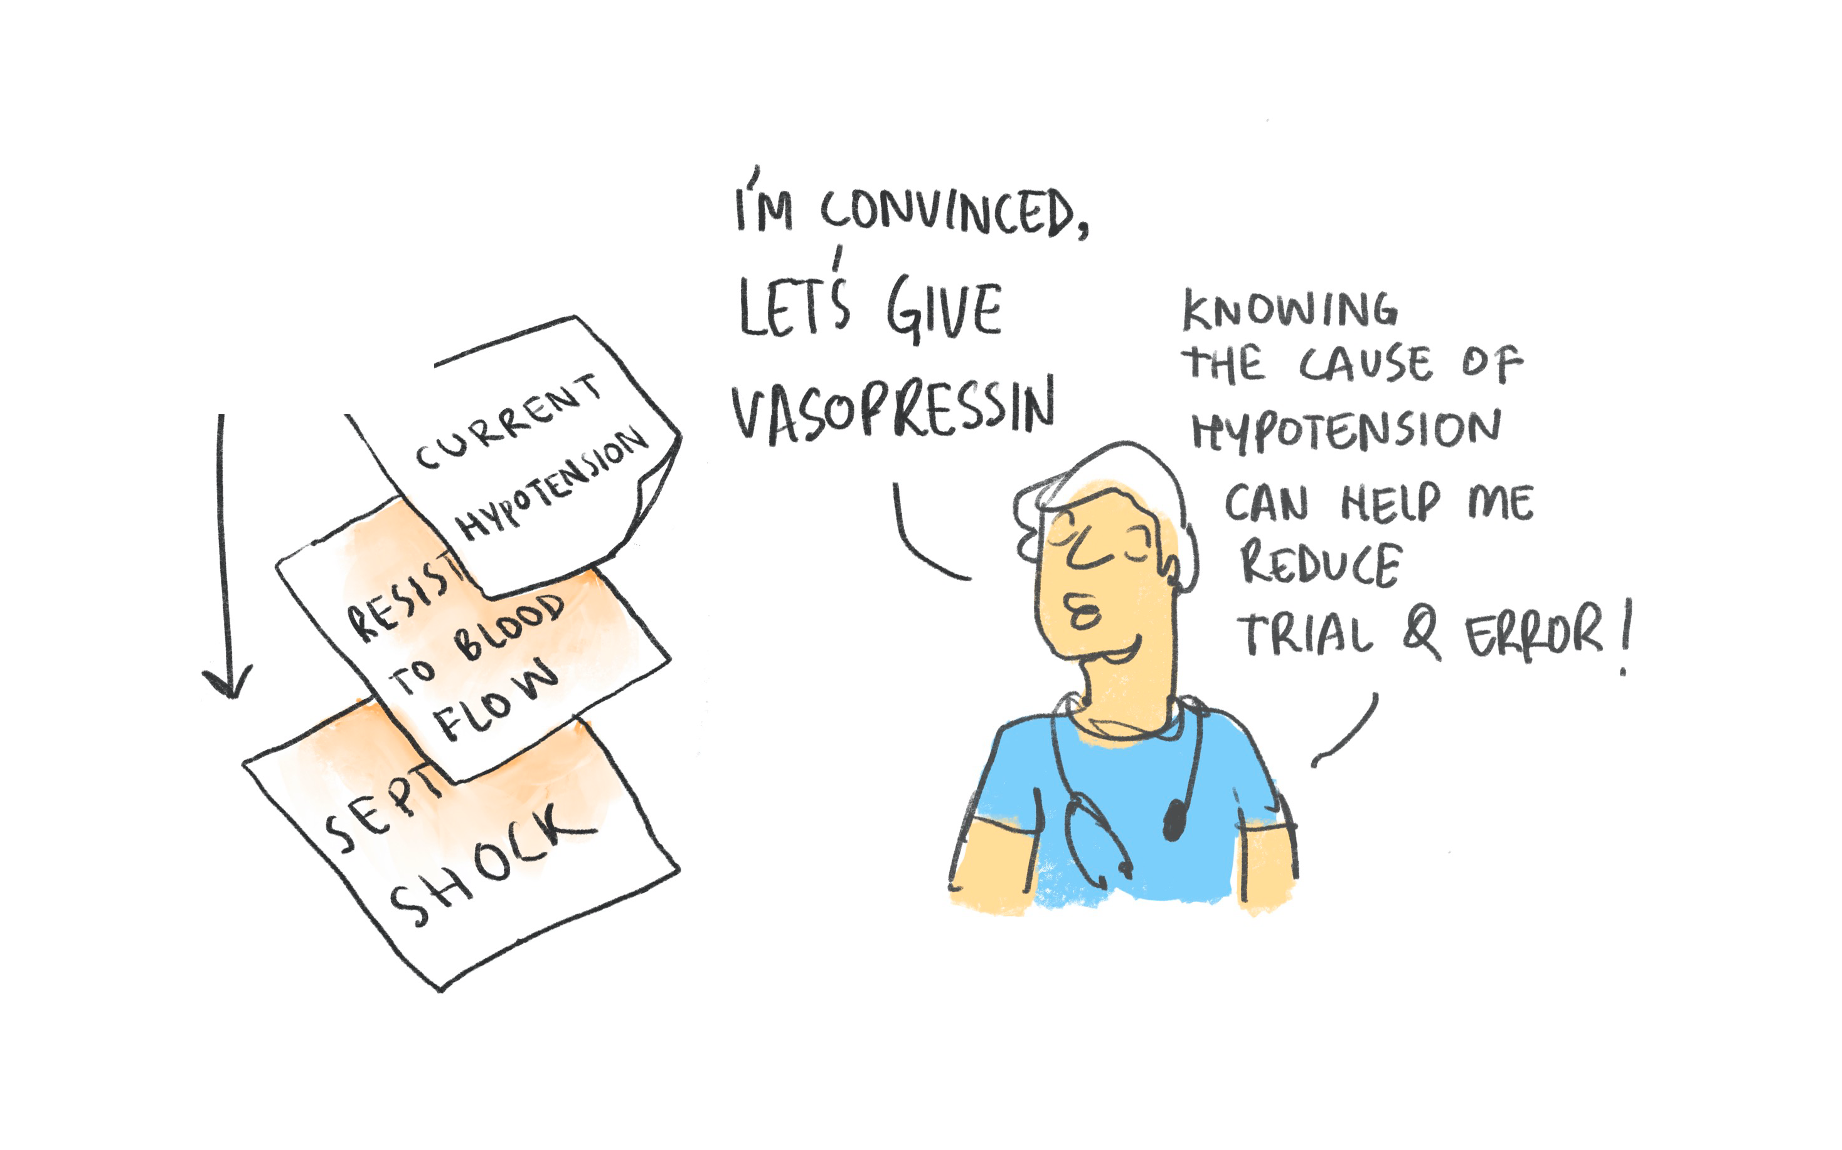
Explainability
This is an important topic to address, specially in healthcare wherein the decision of a clinician depends not only on the prediction but also the reason for it. In the example below, it is key to understand the reasons why the model has churned out a high prediction of 60%. My ML counterparts on the team used a methodology called Shapley values by which one could estimate features that resulted in the prediction. In this example, the BMI, Age and a low Heart Rate are the top reasons for a hypotension prediction. This provides the clinician some more context, based on which they could take the appropriate action.
Results
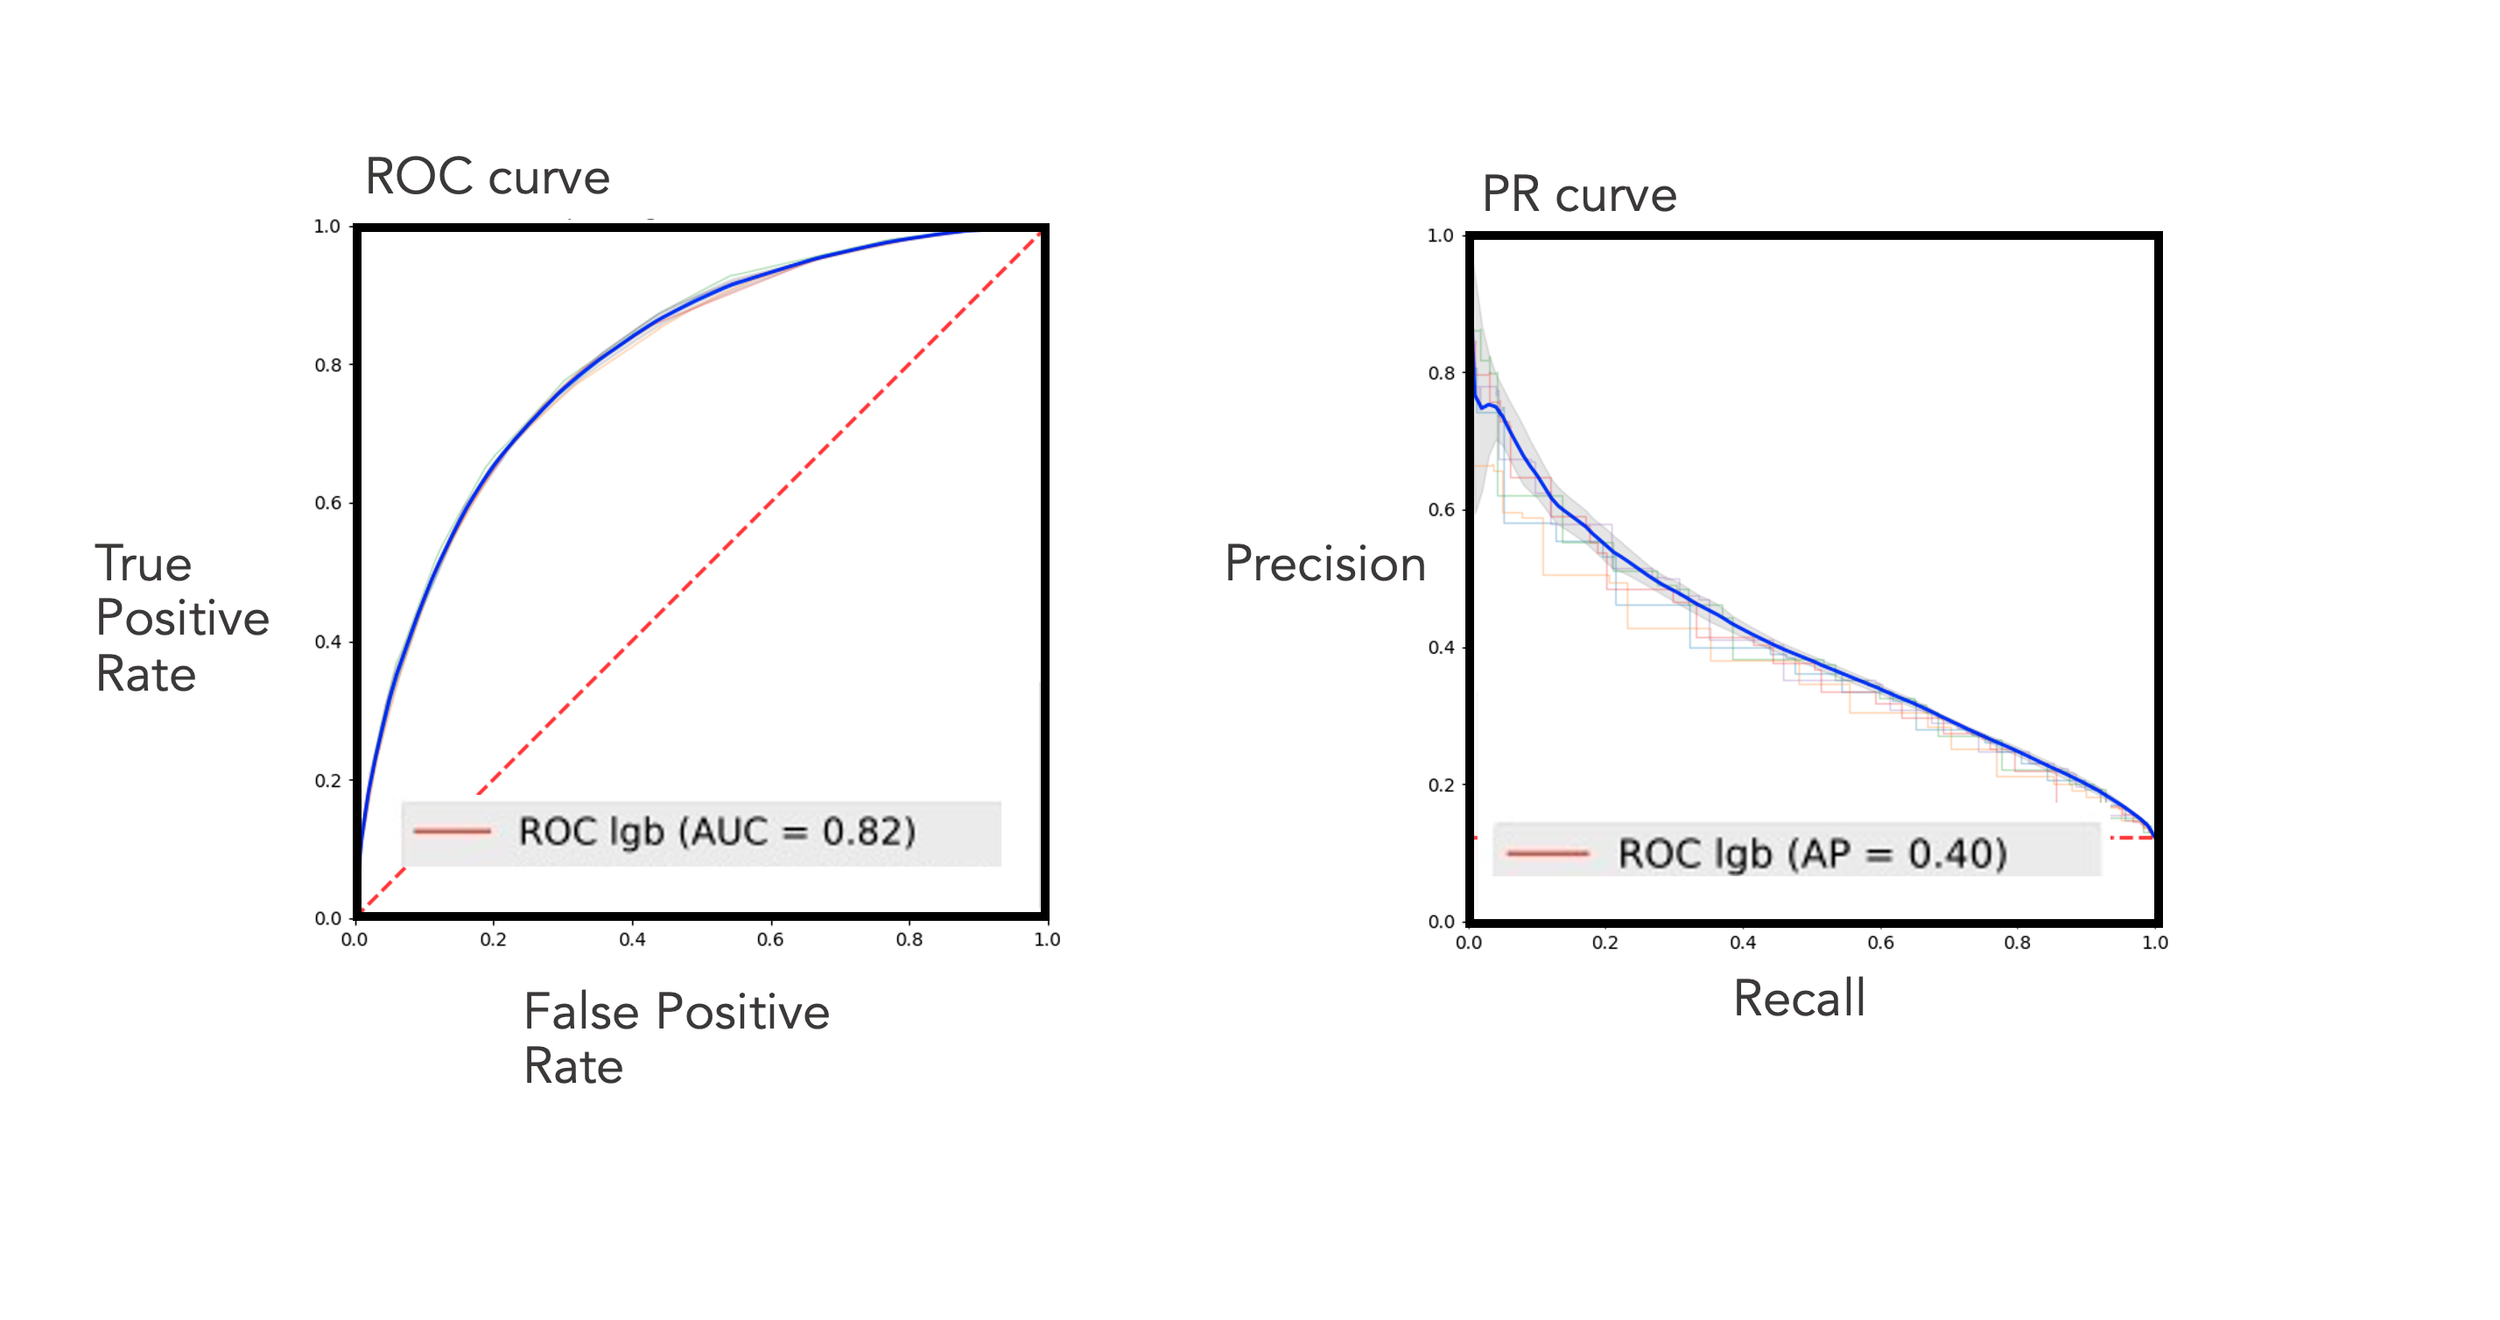
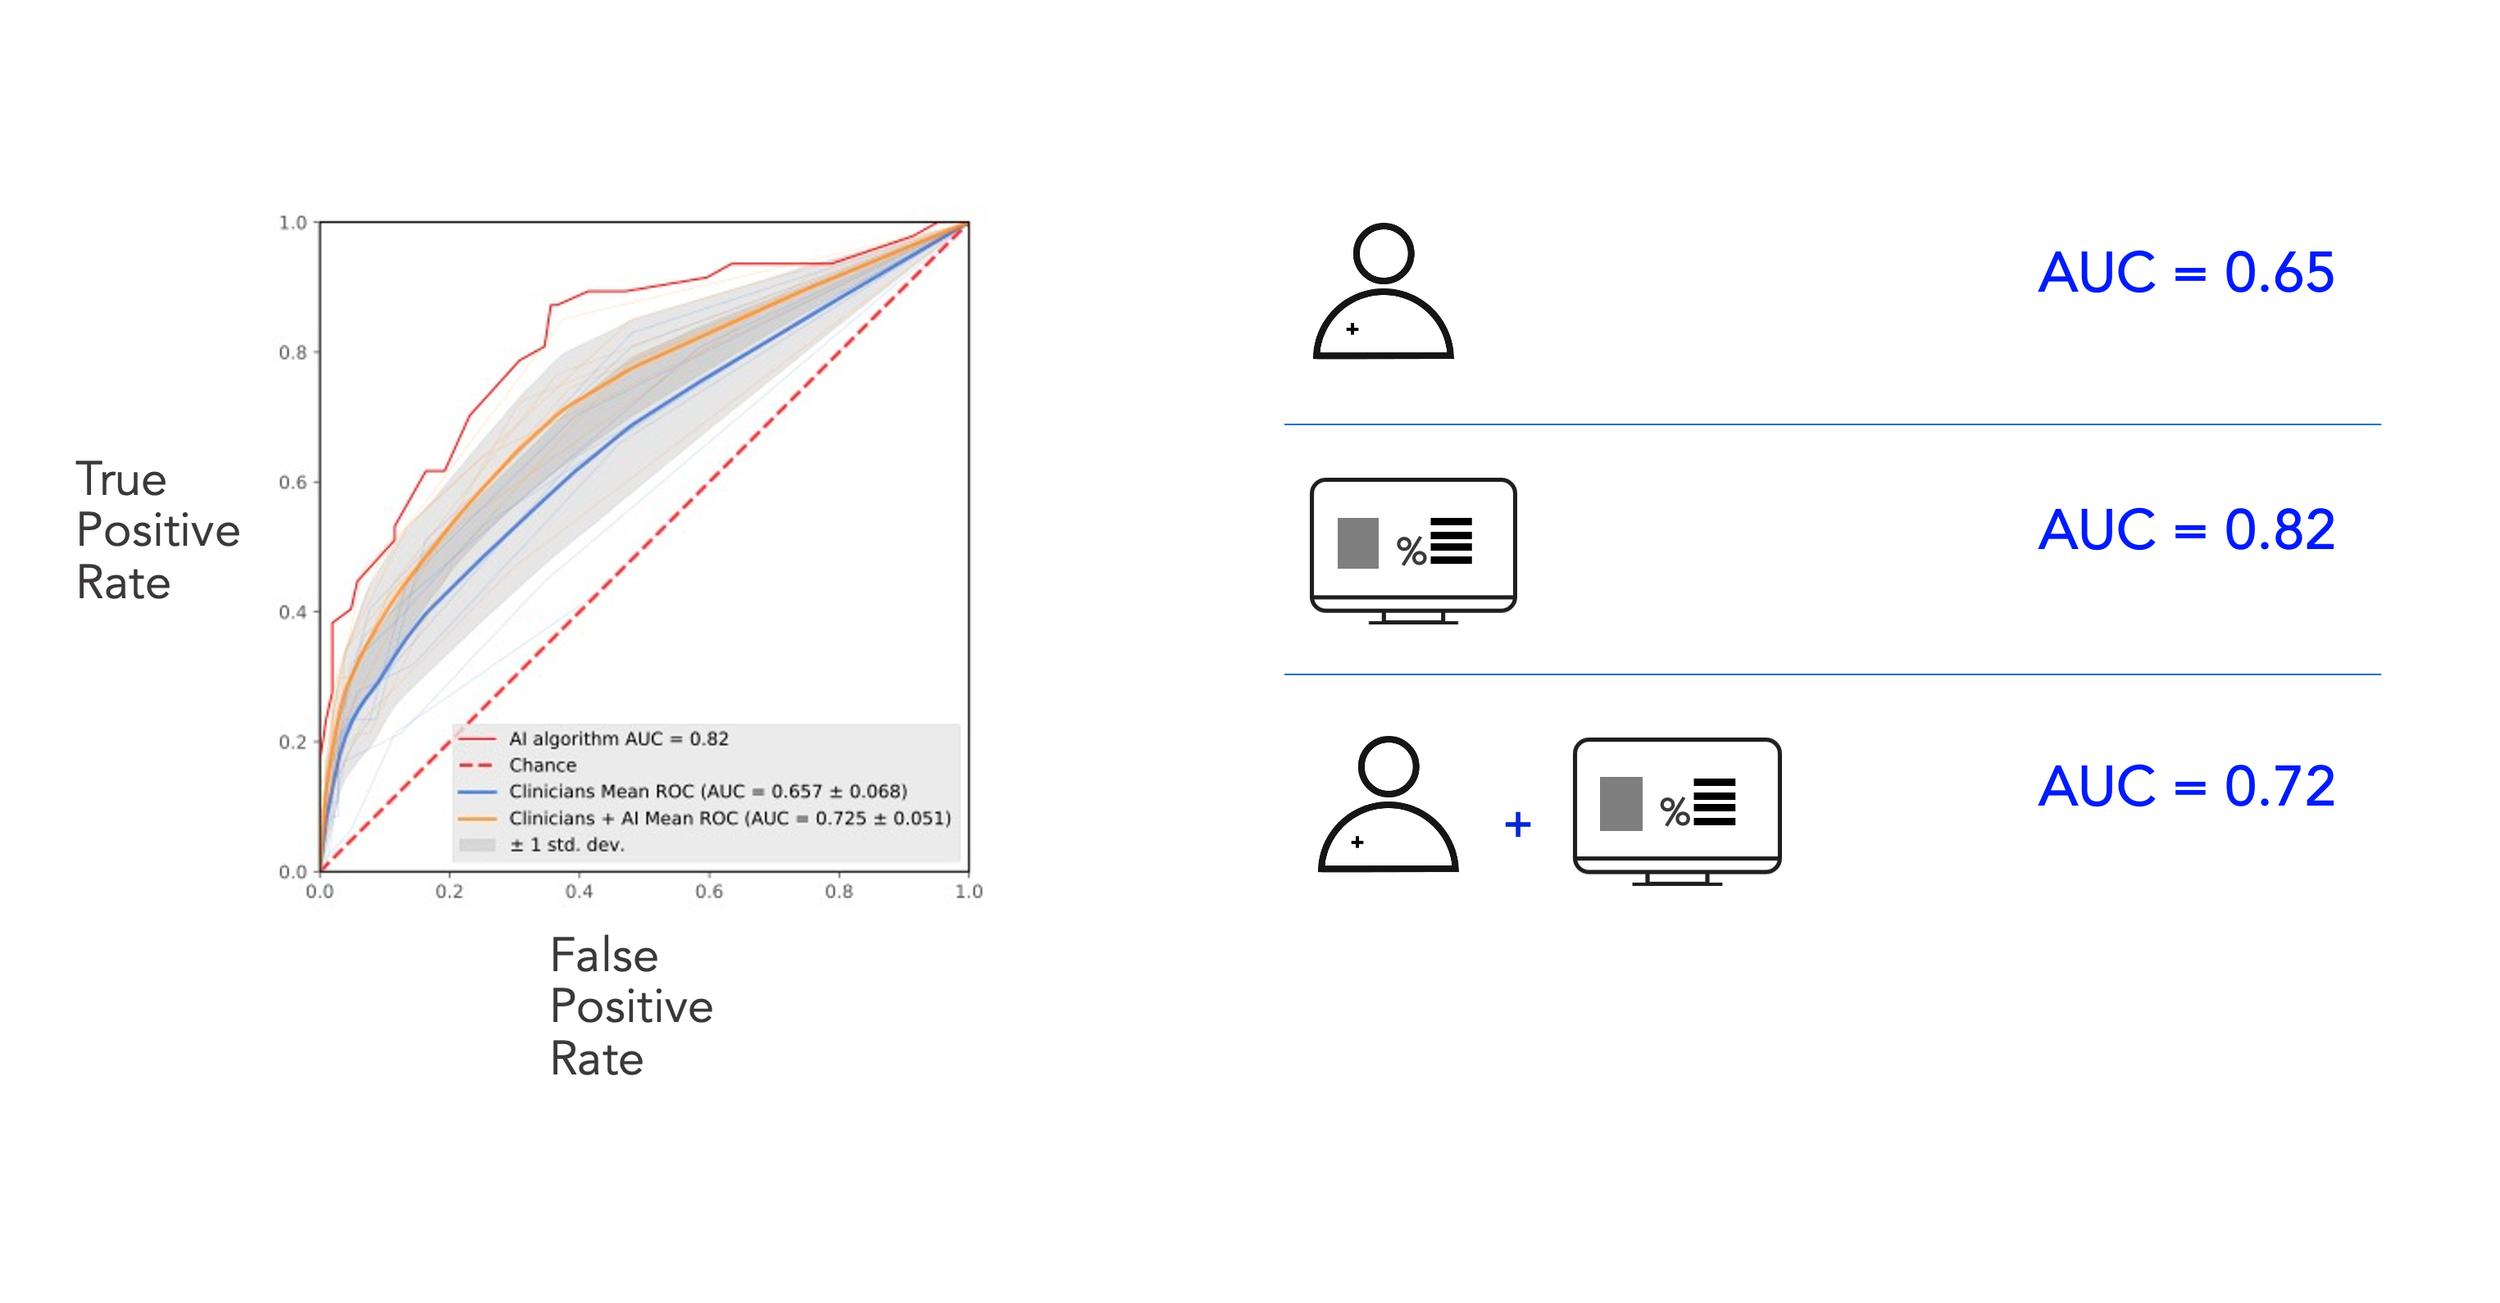
In terms of accuracy of prediction, our best model achieved an AUC of 0.82 on the ROC curve and 0.40 on the precision curve. But, you might ask- what does this mean in practice?
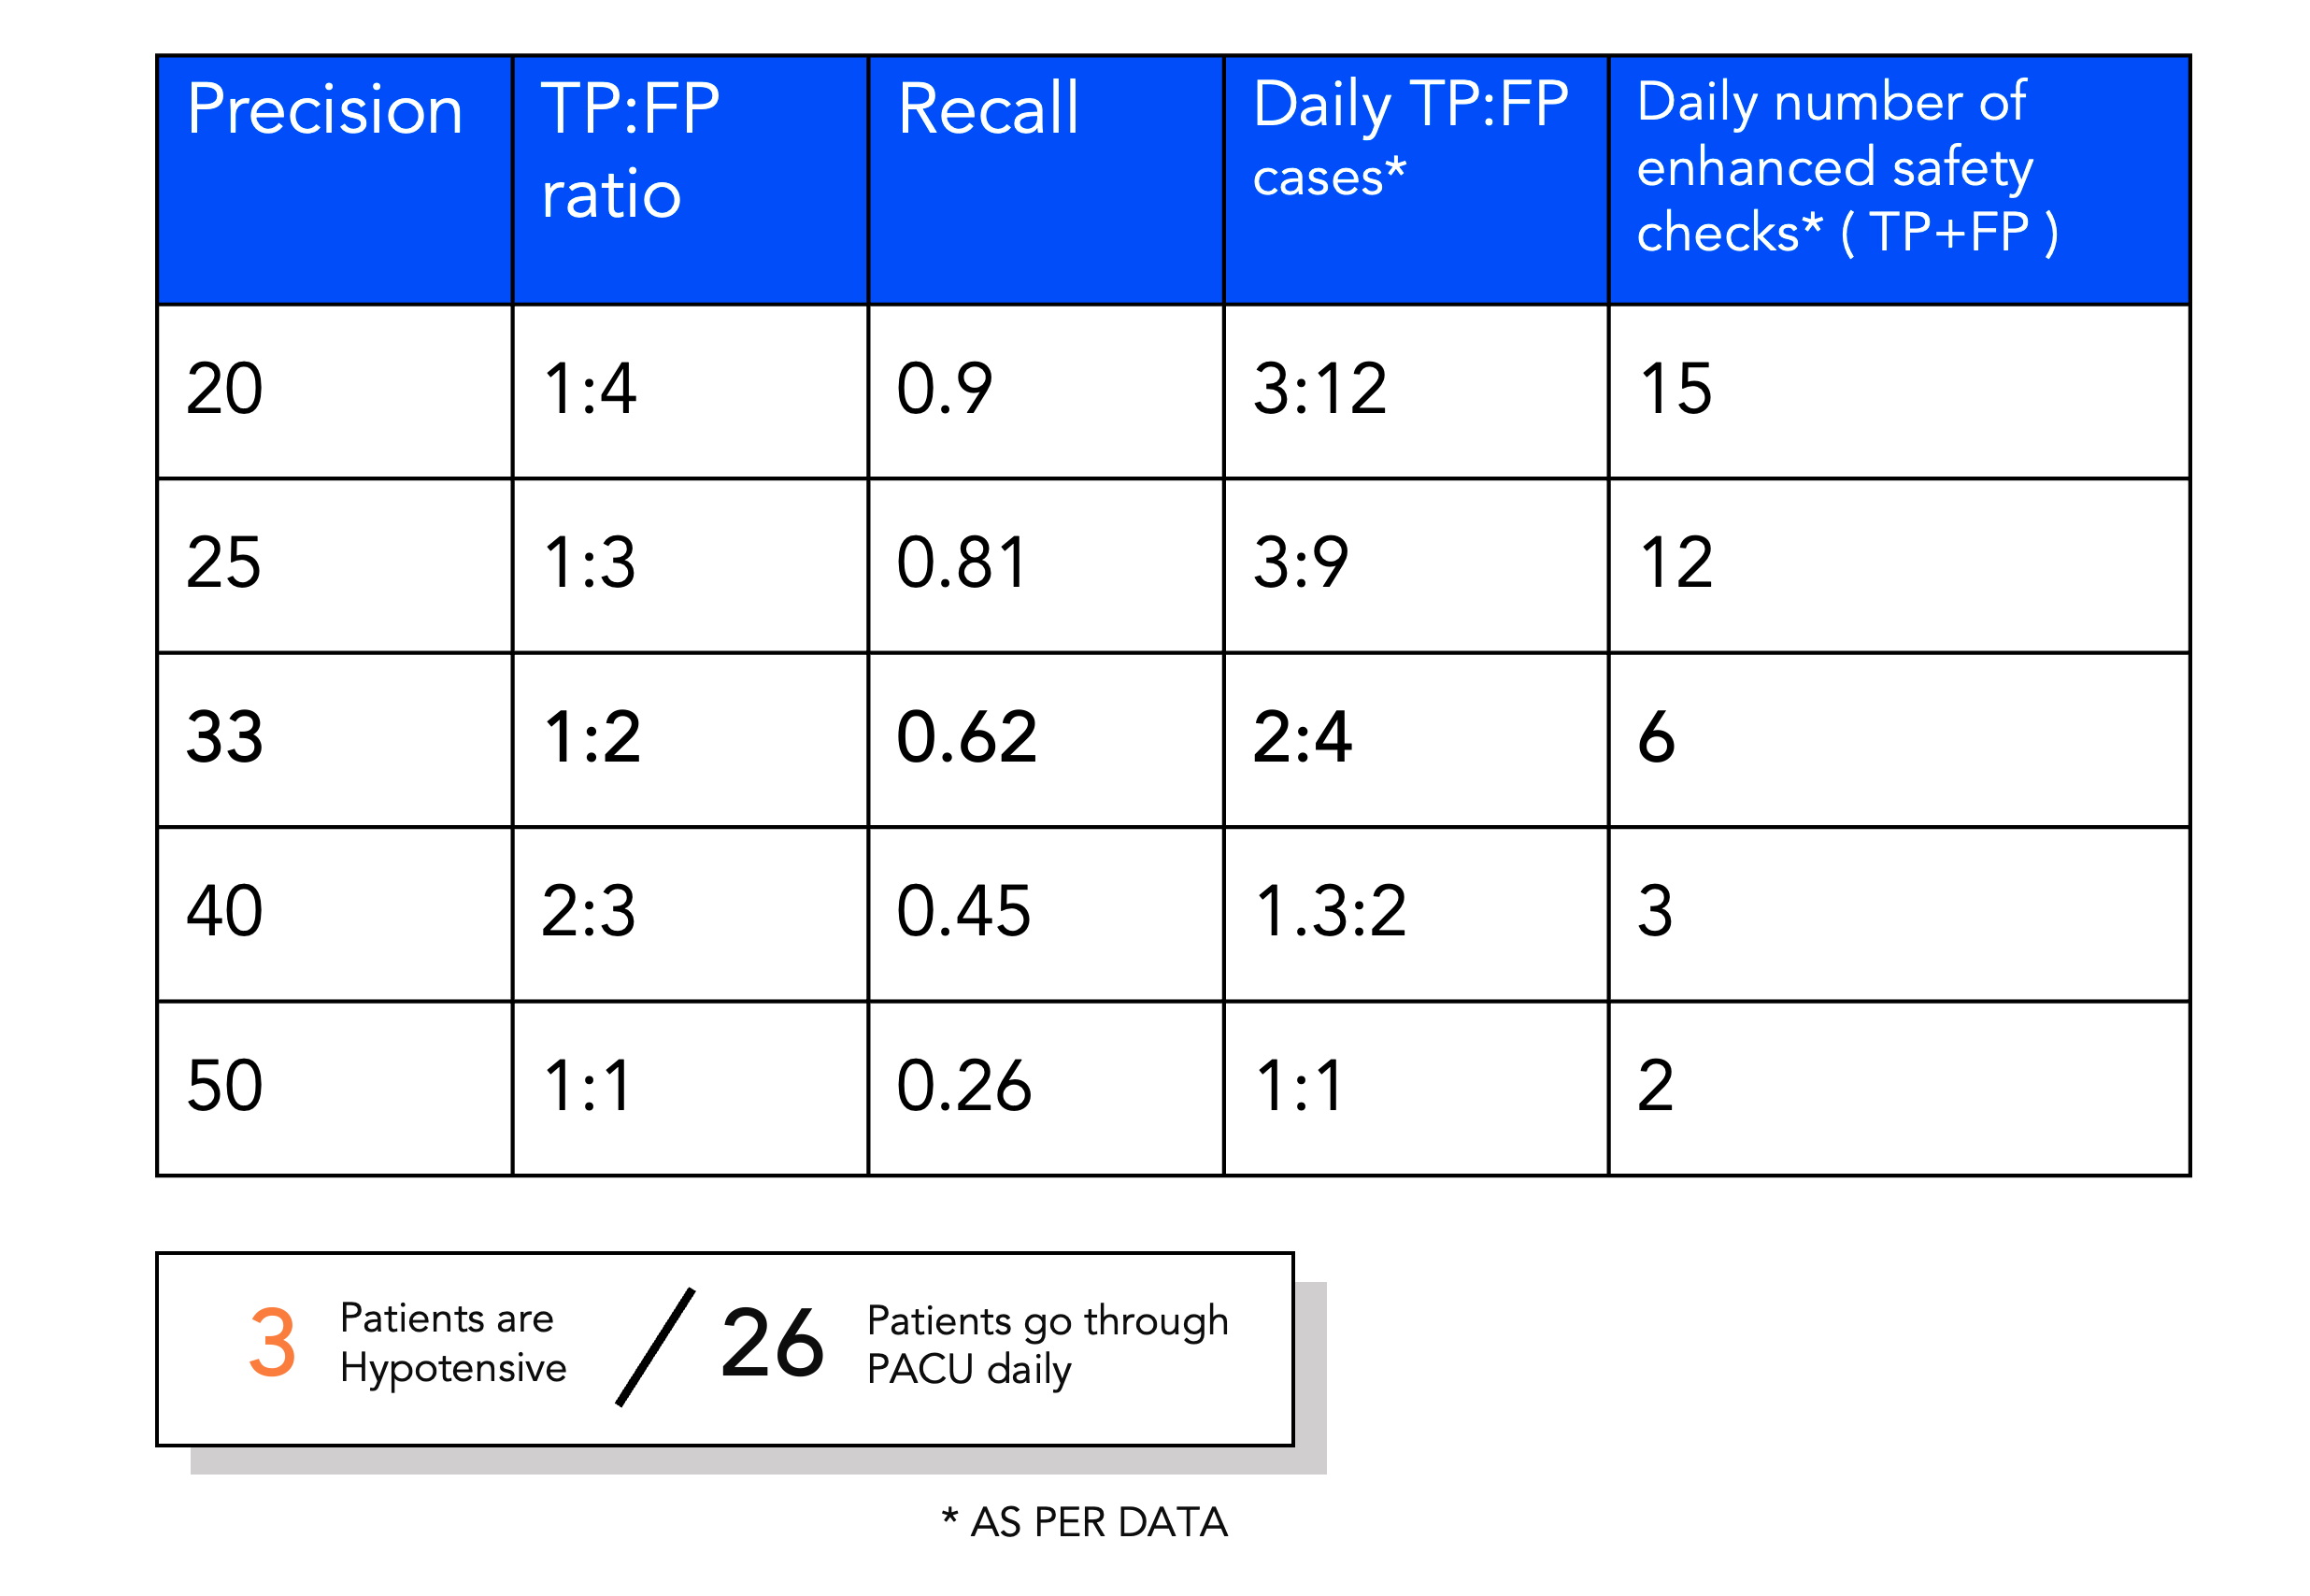
Translating ML outcomes into workload for nurses
From looking at the data, we knew that on an average, there are 26 patients who go through the PACU. My ML colleagues played around with the sensitivity of the model and we took this back to our clinical collaborators to understand what is the appetite for alarms and additional safety checks in their busy schedule. What is the cost of a False Positive? If a prediction is positive, what would the enhanced safety check look like? These are the kind of questions we raised with our users.
Since our solution was to be set up as a track and trigger system, a positive risk prediction is designed to trigger a care protocol to mitigate the risk relative to the normal standard of care. This could be actions such as enhanced safety check on handover, clinician review, increase in monitoring, changed frequence regime or medication preparation.
Key consideration was that the trust in the system would be lost if the number of false positives is high. Economics of false positives is a hard one!
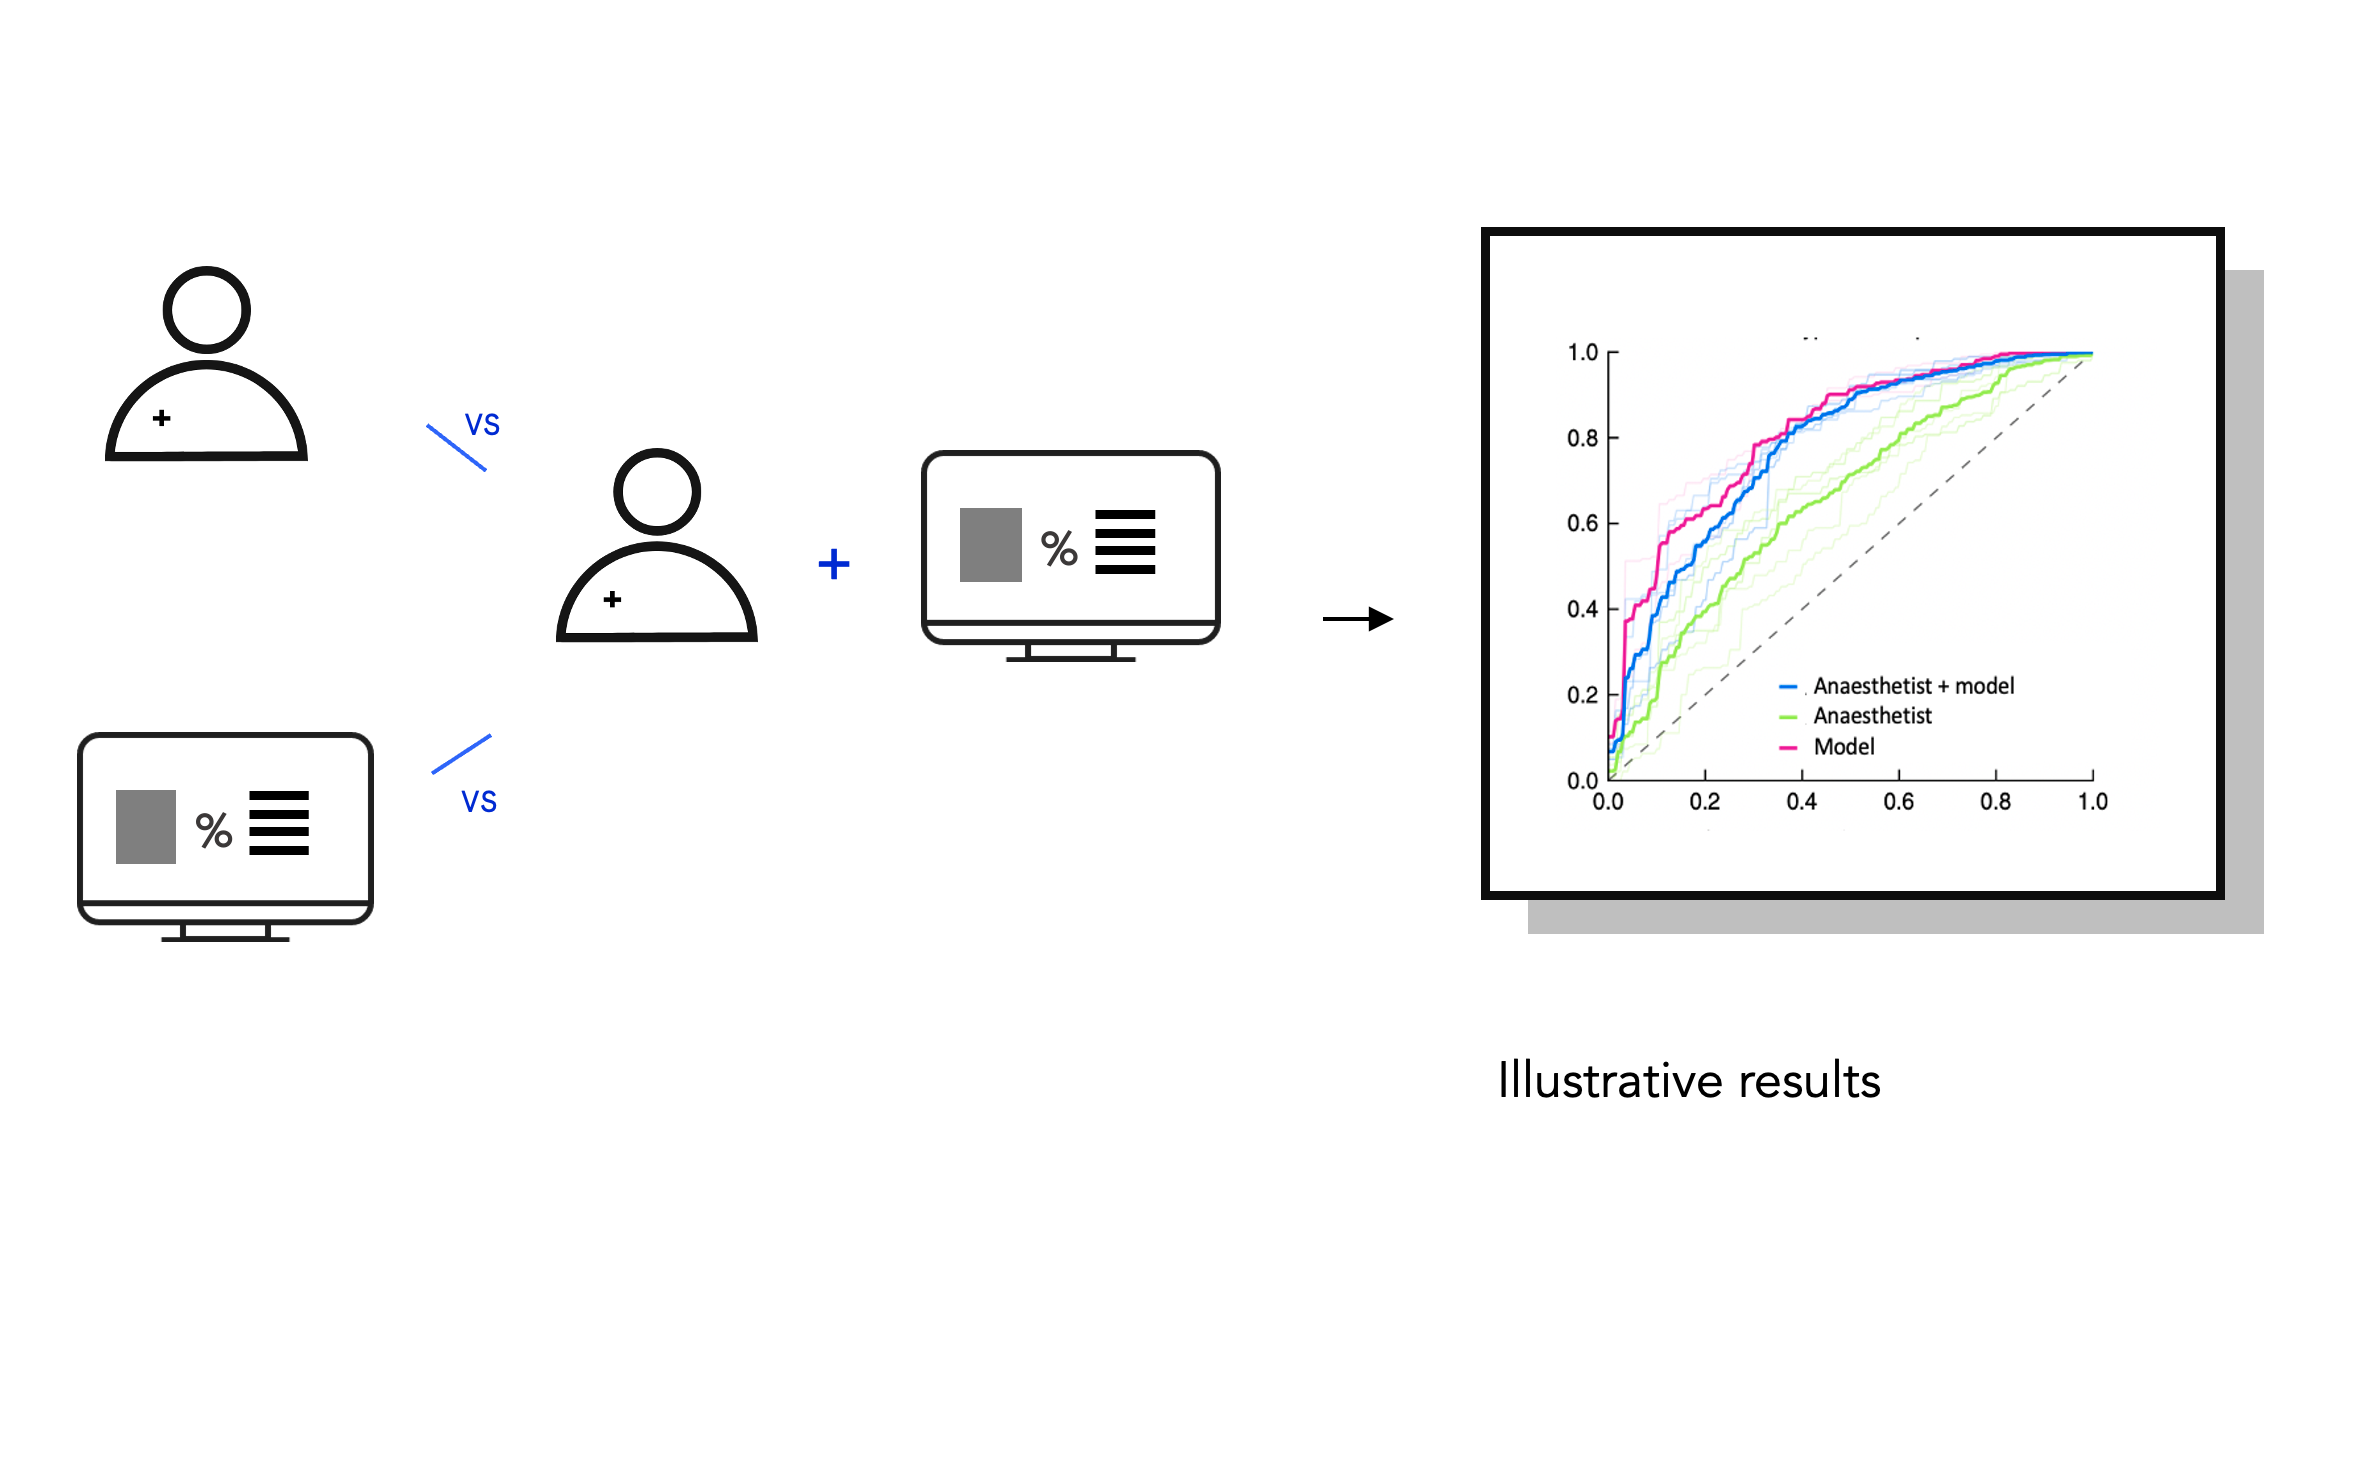
Evaluation: Comparing predictive performance with clinicians
To see whether the model improves predictive performance over an anaesthetist’s ability we also ran an evaluation study. Using on pre-recorded inter-operative data from our test data set we replayed cases back to anaesthetists and asked them to say whether they thought the patient would become hypotensive or not. Then we showed them the ML outcome and asked the same question.
Our evaluation tool of choice was a web app that I designed and developed along with a teammate who is an engineer. The design of the UI had to be as close to the real thing as possible to avoid misinterpretation of the data. Manual anaesthesia records look something like this 👇🏼
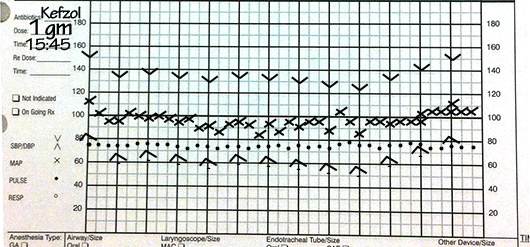
Web app for evaluating ML outcomes
I designed the interface in line with how anesthesiologists read charts. The implementation was done using React and Flask to serve our app. About 192 cases were shown to each study participant; first without ML prediction and then with. Their response was captured on the scale of 0-100% at intervals of 10.
Before settling on the final design, I obviously did generate various iterations and concepts to capture the users’ imagination of future predictive tools in a hospital setting. 🔮🏥
Understanding the wiggle room is important for physicians to know how much low blood pressure can a patient tolerate. This is dependent on their age, body weight, height and a range of other factors. So, imagine a tool that helps them gauge this wiggle room so that they can keep the patient’s organs adequately perfused during a surgical procedure. 👇🏼
Results!
Our findings were published in the British Journal of Anaesthesia. We also published another paper on the framing of ML opportunities through user studies and design research. Overall, our best model achieved an Area Under the Curve score of 0.72 along with the human in the loop. Without our intervention, the human performed a score of 0.65. While we were ecstatic with our results, there is a lot of work that needs to be done in terms of studying the impact of such a solution on the lives of patients and clinicians. Super exciting area of research, which I hope to delve further into in the future. Thank you for reading!
Click on the paper thumbnails below to access the publications. 👇🏼👇🏼
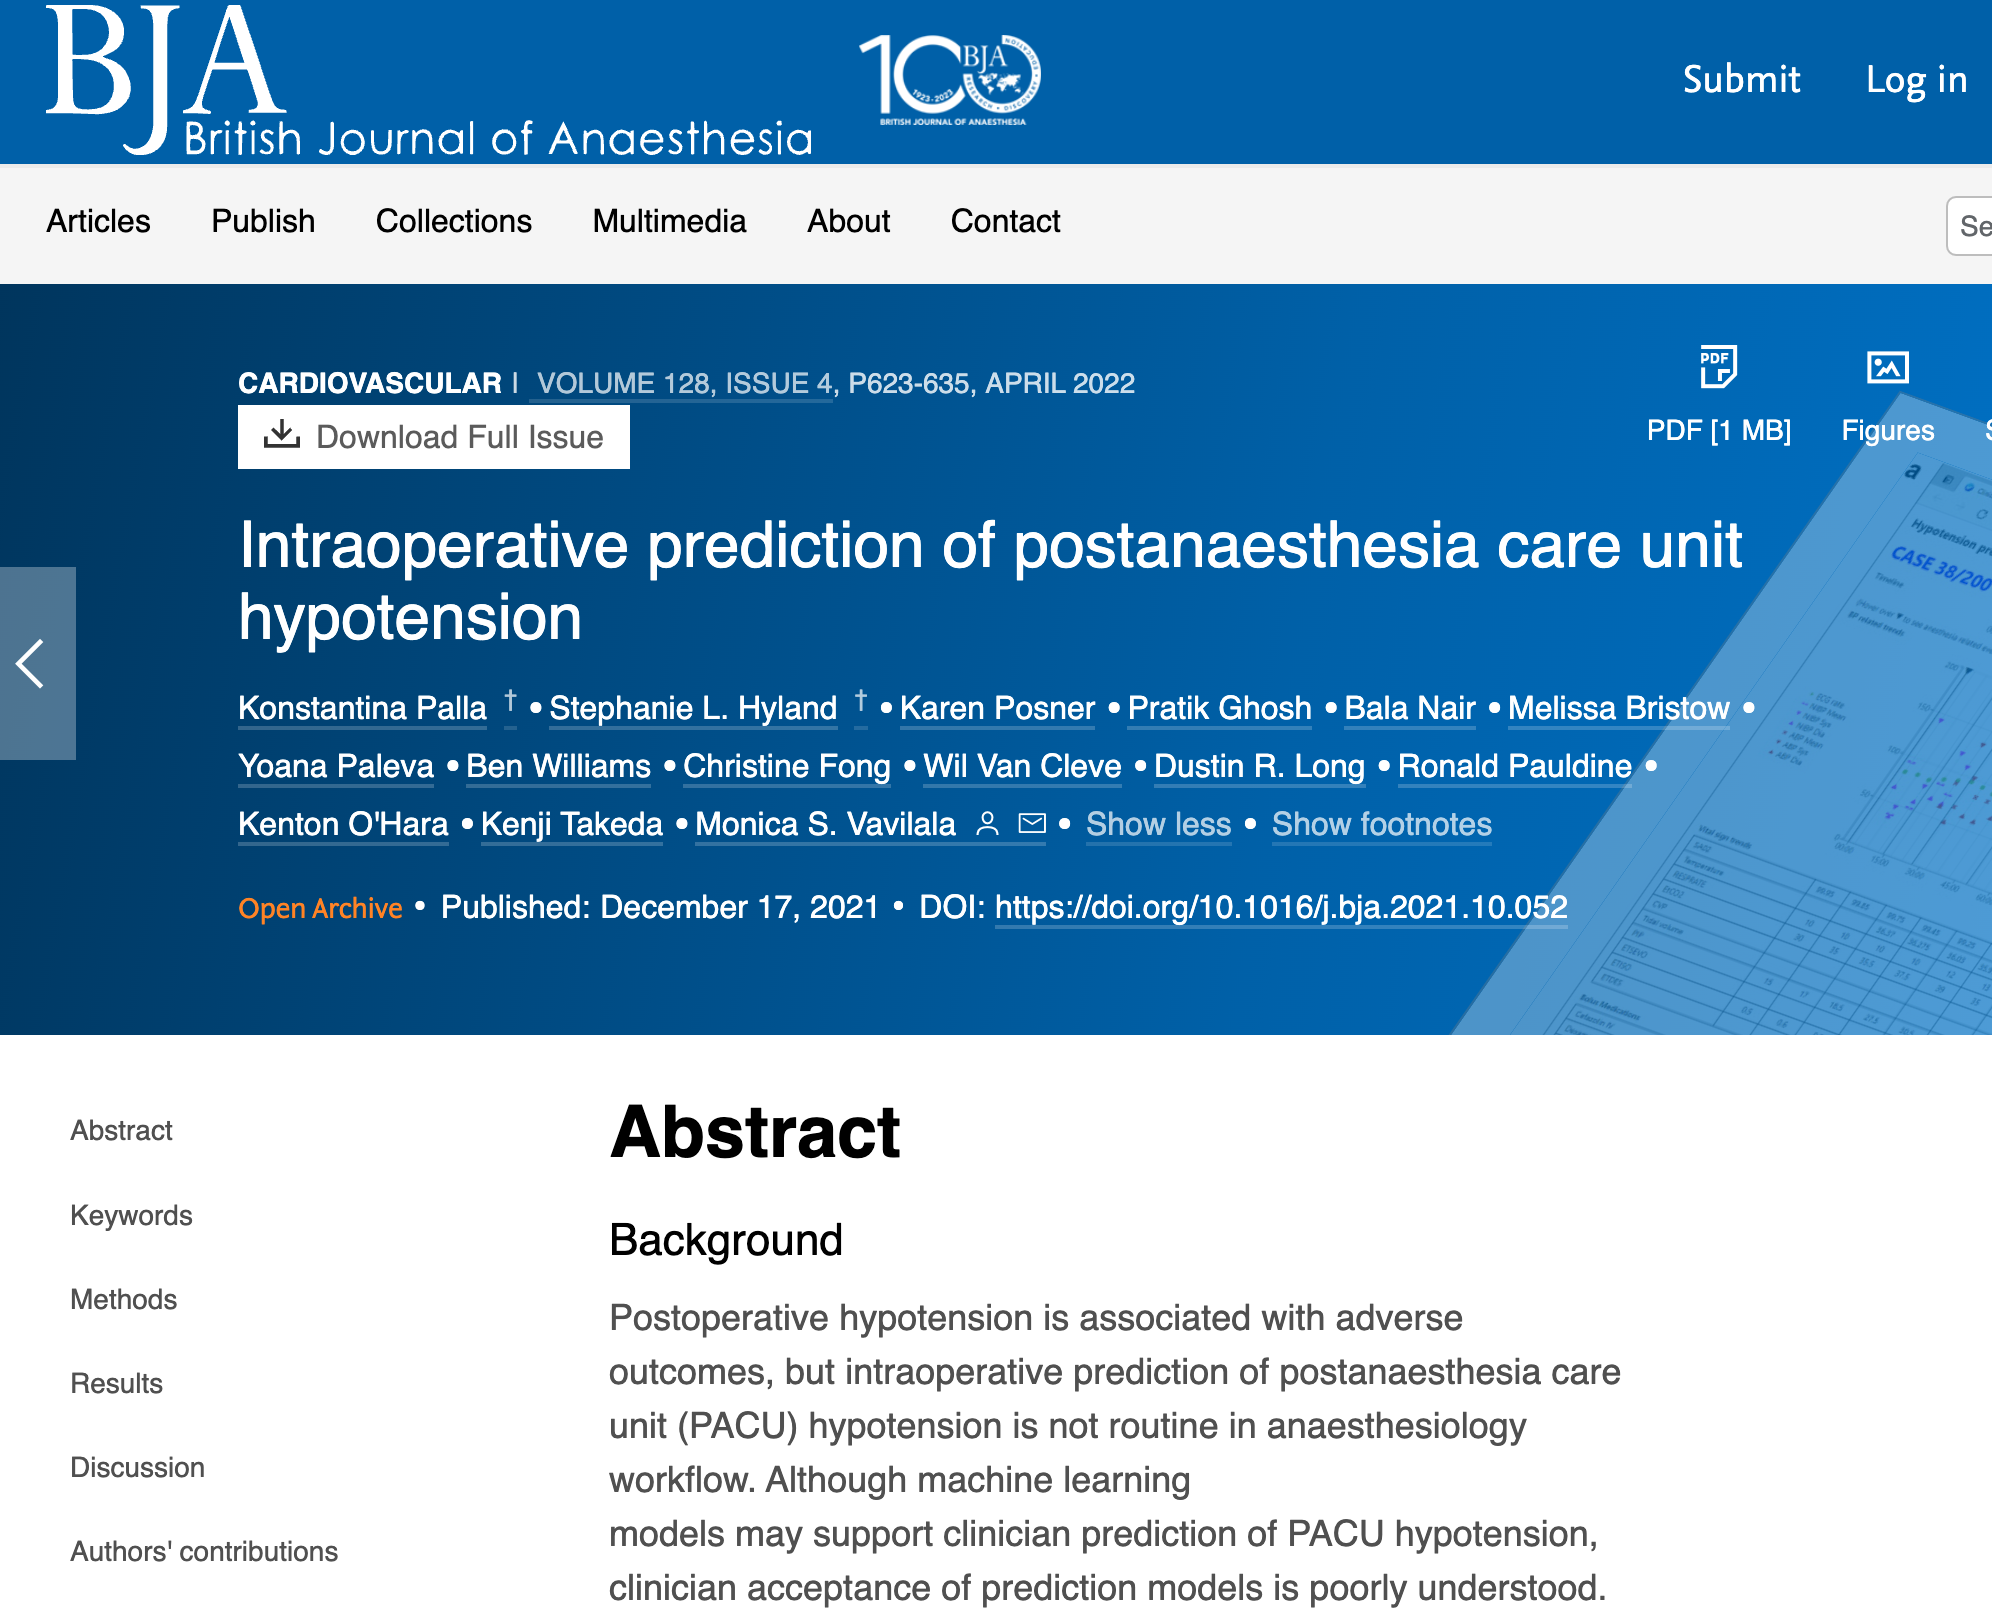
BJA paper
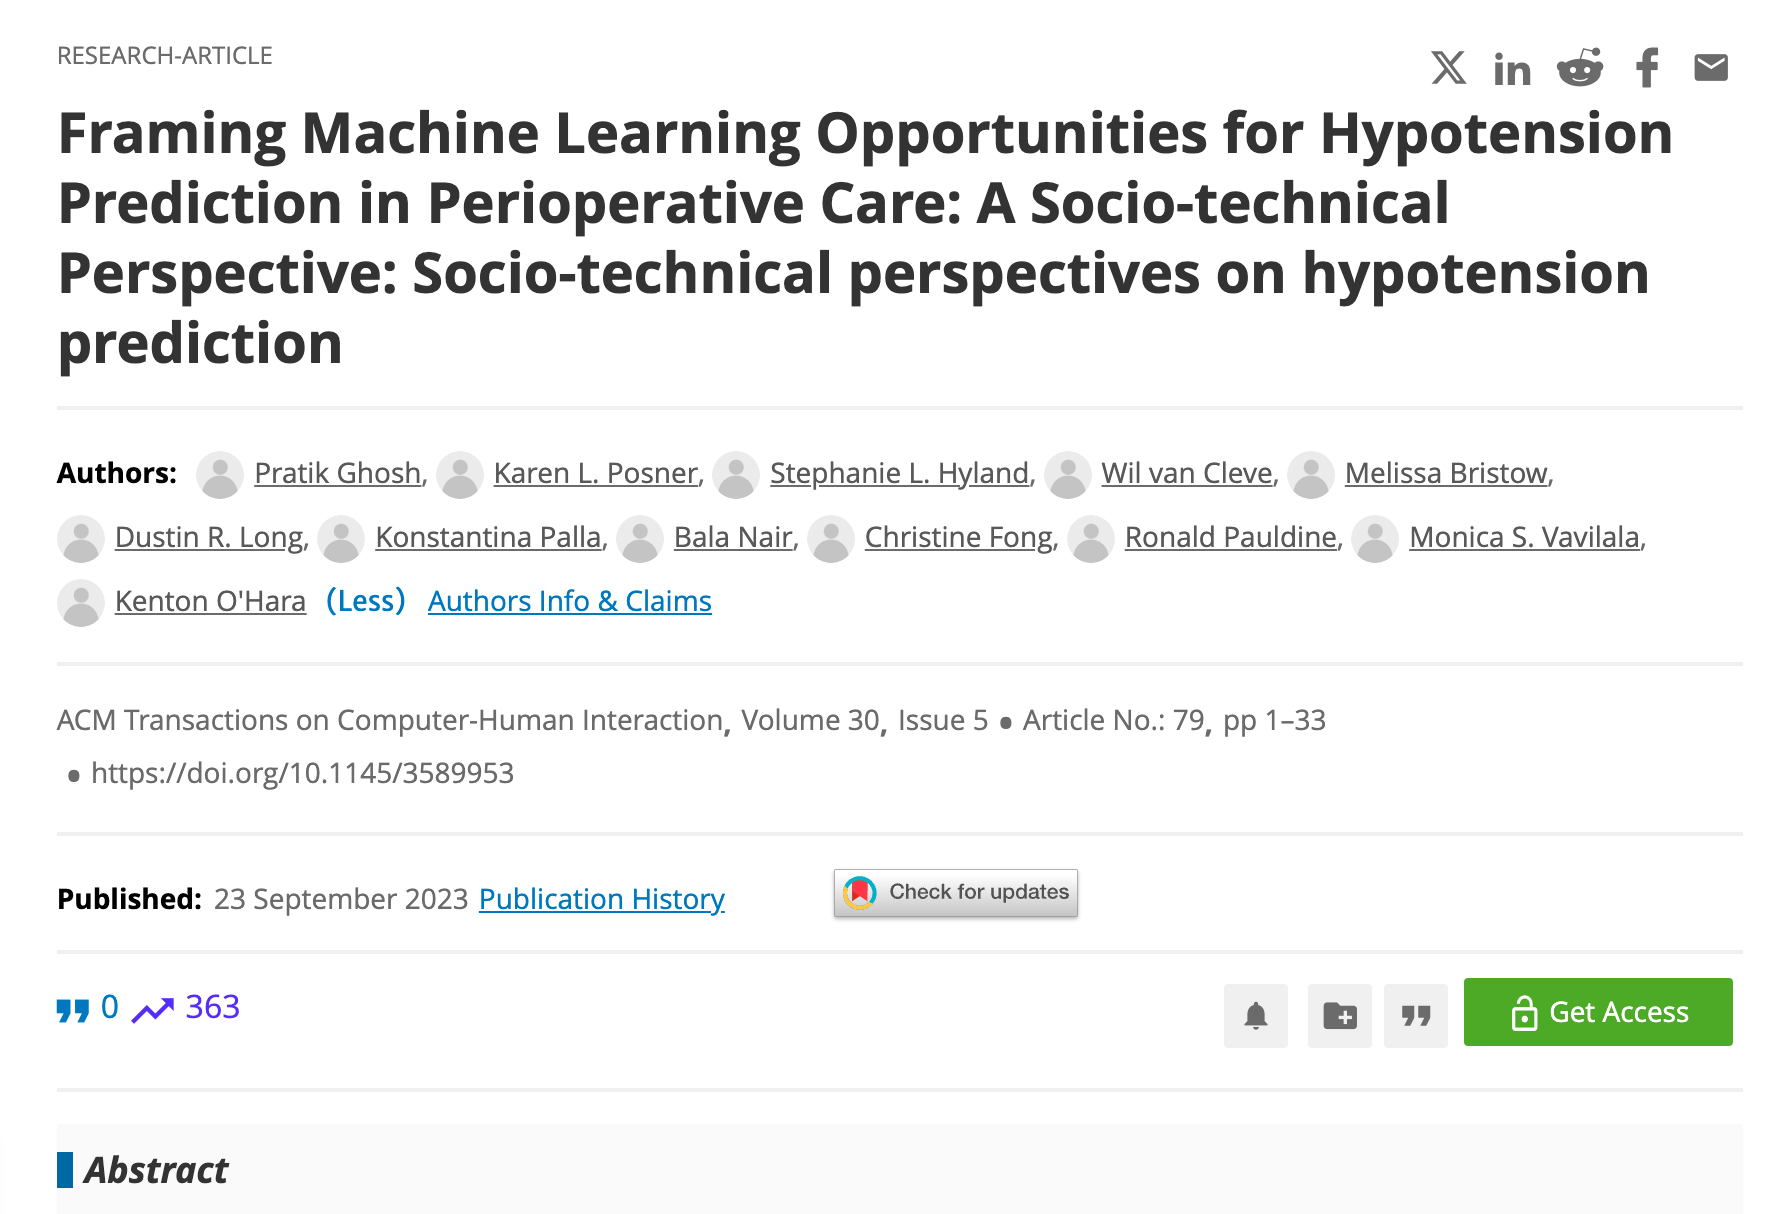
TOCHI paper